This article was created before Azure Stack HCI was renamed to Azure Local (link) in November 2024, which is why some references or hardcoded URLs may still point to Azure Stack HCI. However, the content has been updated accordingly, and if you find any errors, I would greatly appreciate it if you could report them either through the comment function or by emailing blog@schmitt-nieto.com
Azure Local Day 2 Operations
Welcome back to the Chronicloud Series! If you’ve been following along, you should now have a fully provisioned Azure Local DemoLab. In the previous article, Azure Local DemoLab, we took you through the process of setting up Azure Local in a clean environment, highlighting the steps necessary to bring your infrastructure online. But provisioning is just the beginning!
Now that your HCI environment is up and running, it’s time to explore the essential Day 2 Operations, the next steps that will bring your infrastructure to full functionality. These are the critical actions required after your deployment to ensure that your environment is secure, performant, and ready for production workloads. Whether you’re preparing to deploy virtual machines (VMs), Azure Virtual Desktop (AVD), or Kubernetes clusters, this guide will help you configure and activate all the necessary features.
In addition to setting up networking and management tools, we’ll also cover the important task of downloading and configuring VM images required for VM workloads and AVD. These images are essential for deploying VMs and ensuring that Azure Local is ready to handle Windows Server workloads from the Azure Marketplace.
Day 2 operations are about configuring and activating the capabilities you need to run a stable, secure, and performant infrastructure. You’ll learn how to:
- Understand the integration between Azure and your on-premises infrastructure through the Azure Arc Resource Bridge.
- Set up logical networks to support key workloads like AKS (Azure Kubernetes Service), AVD (Azure Virtual Desktop), and VMs (virtual machines).
- Activate Windows Admin Center (WAC) to manage your HCI environment, while understanding its different versions and limitations.
- Enable monitoring, alerting, and other management tools to keep your system healthy.
- Download and manage VM images for your workloads, which will unlock the ability to deploy VMs and AVD.
Each of these steps is crucial for ensuring your Azure Local environment is fully integrated with Azure, optimized for workloads, and ready for production. Let’s get started by diving into what powers this integration: Azure Arc Resource Bridge.
The Magic Behind Azure Local: Azure Arc Resource Bridge
Azure Local integrates seamlessly with Azure using the Azure Arc Resource Bridge. This bridge is essential in enabling your on-premises infrastructure to act like a cloud, hosting various Azure services and solutions in your private cloud environment.
Key Components of the Arc Resource Bridge
The Azure Arc Resource Bridge is a multi-layered system that enables deep functionality for private clouds. It consists of:
- Base Layer: This layer includes the resource bridge itself and the Arc agents responsible for managing communication between Azure and your infrastructure.
- Platform Layer: This layer contains custom locations and cluster extensions. Custom locations define where Azure resources are deployed (for example, mapping a custom location to an Azure Local cluster), and cluster extensions represent Azure services running on-premises, such as Azure Arc VM management.
- Solution Layer: The solution layer supports each service running on the Azure Arc resource bridge, such as different types of virtual machines (VMs).
Services Supported by the Arc Resource Bridge
The Arc Resource Bridge hosts two primary objects:
- Cluster Extension: This includes services like Azure Arc VM management, Azure Arc-enabled VMware, and Azure Arc-enabled System Center Virtual Machine Manager (SCVMM).
- Custom Locations: These define the targets for deployment. For instance, when you create a VM on Azure Local, the custom location will map to your HCI cluster.
One of the most powerful aspects of the Arc Resource Bridge is that it projects on-premises resources into Azure, allowing you to manage them from the cloud. However, keep in mind that issues with on-premises infrastructure (like the accidental deletion of the resource bridge) can affect your ability to manage these resources through Azure. Although your VMs will still run locally, Azure-based management will be disrupted.
Azure Arc Resource Bridge Architecture
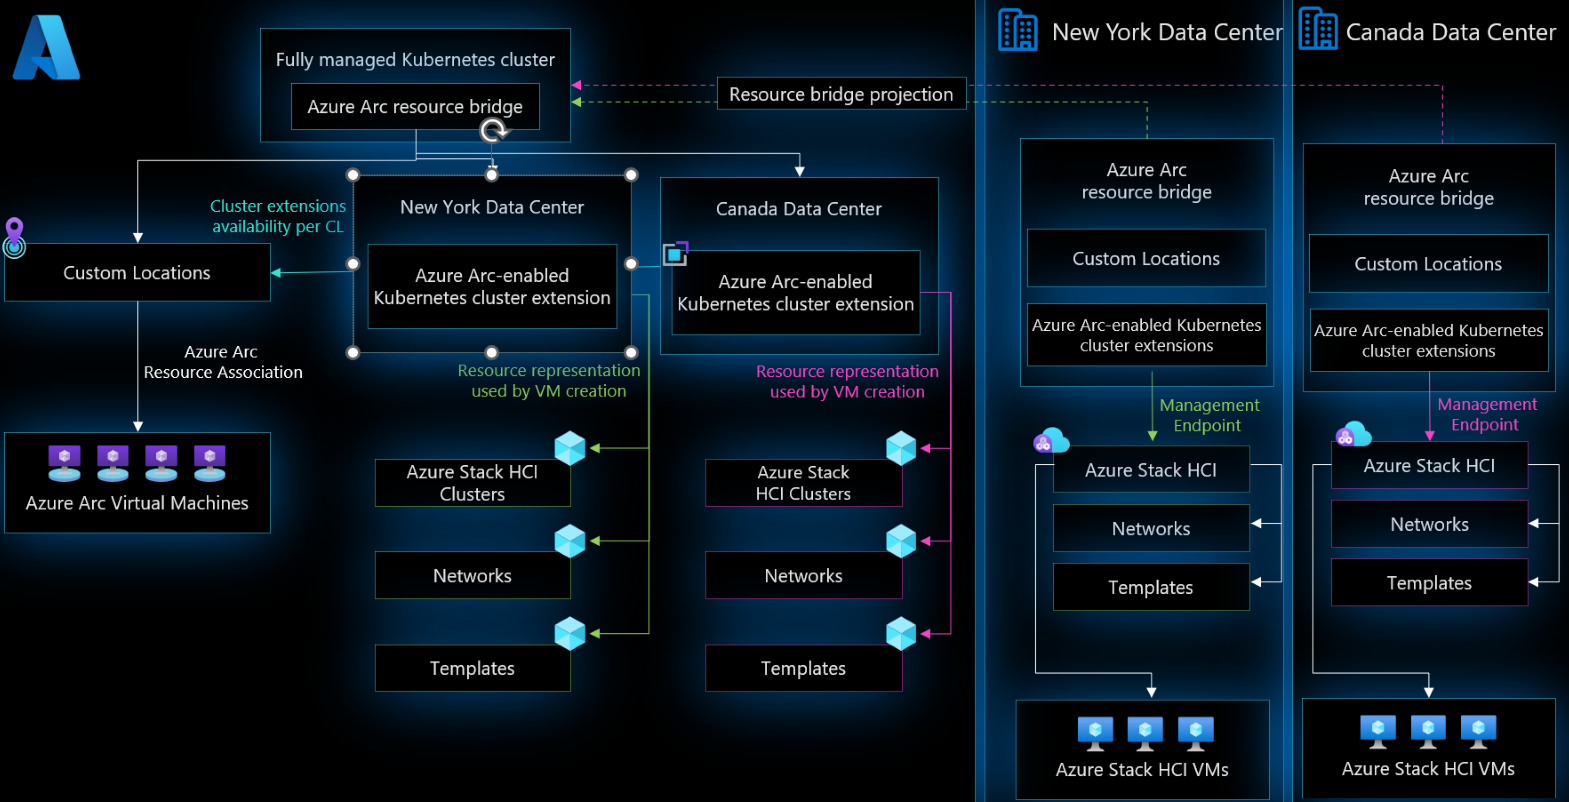
The Azure Arc Resource Bridge is a complex yet elegant system that makes hybrid cloud management a reality. Here’s an architectural diagram that showcases the flow of data and services between Azure and your on-premises infrastructure.
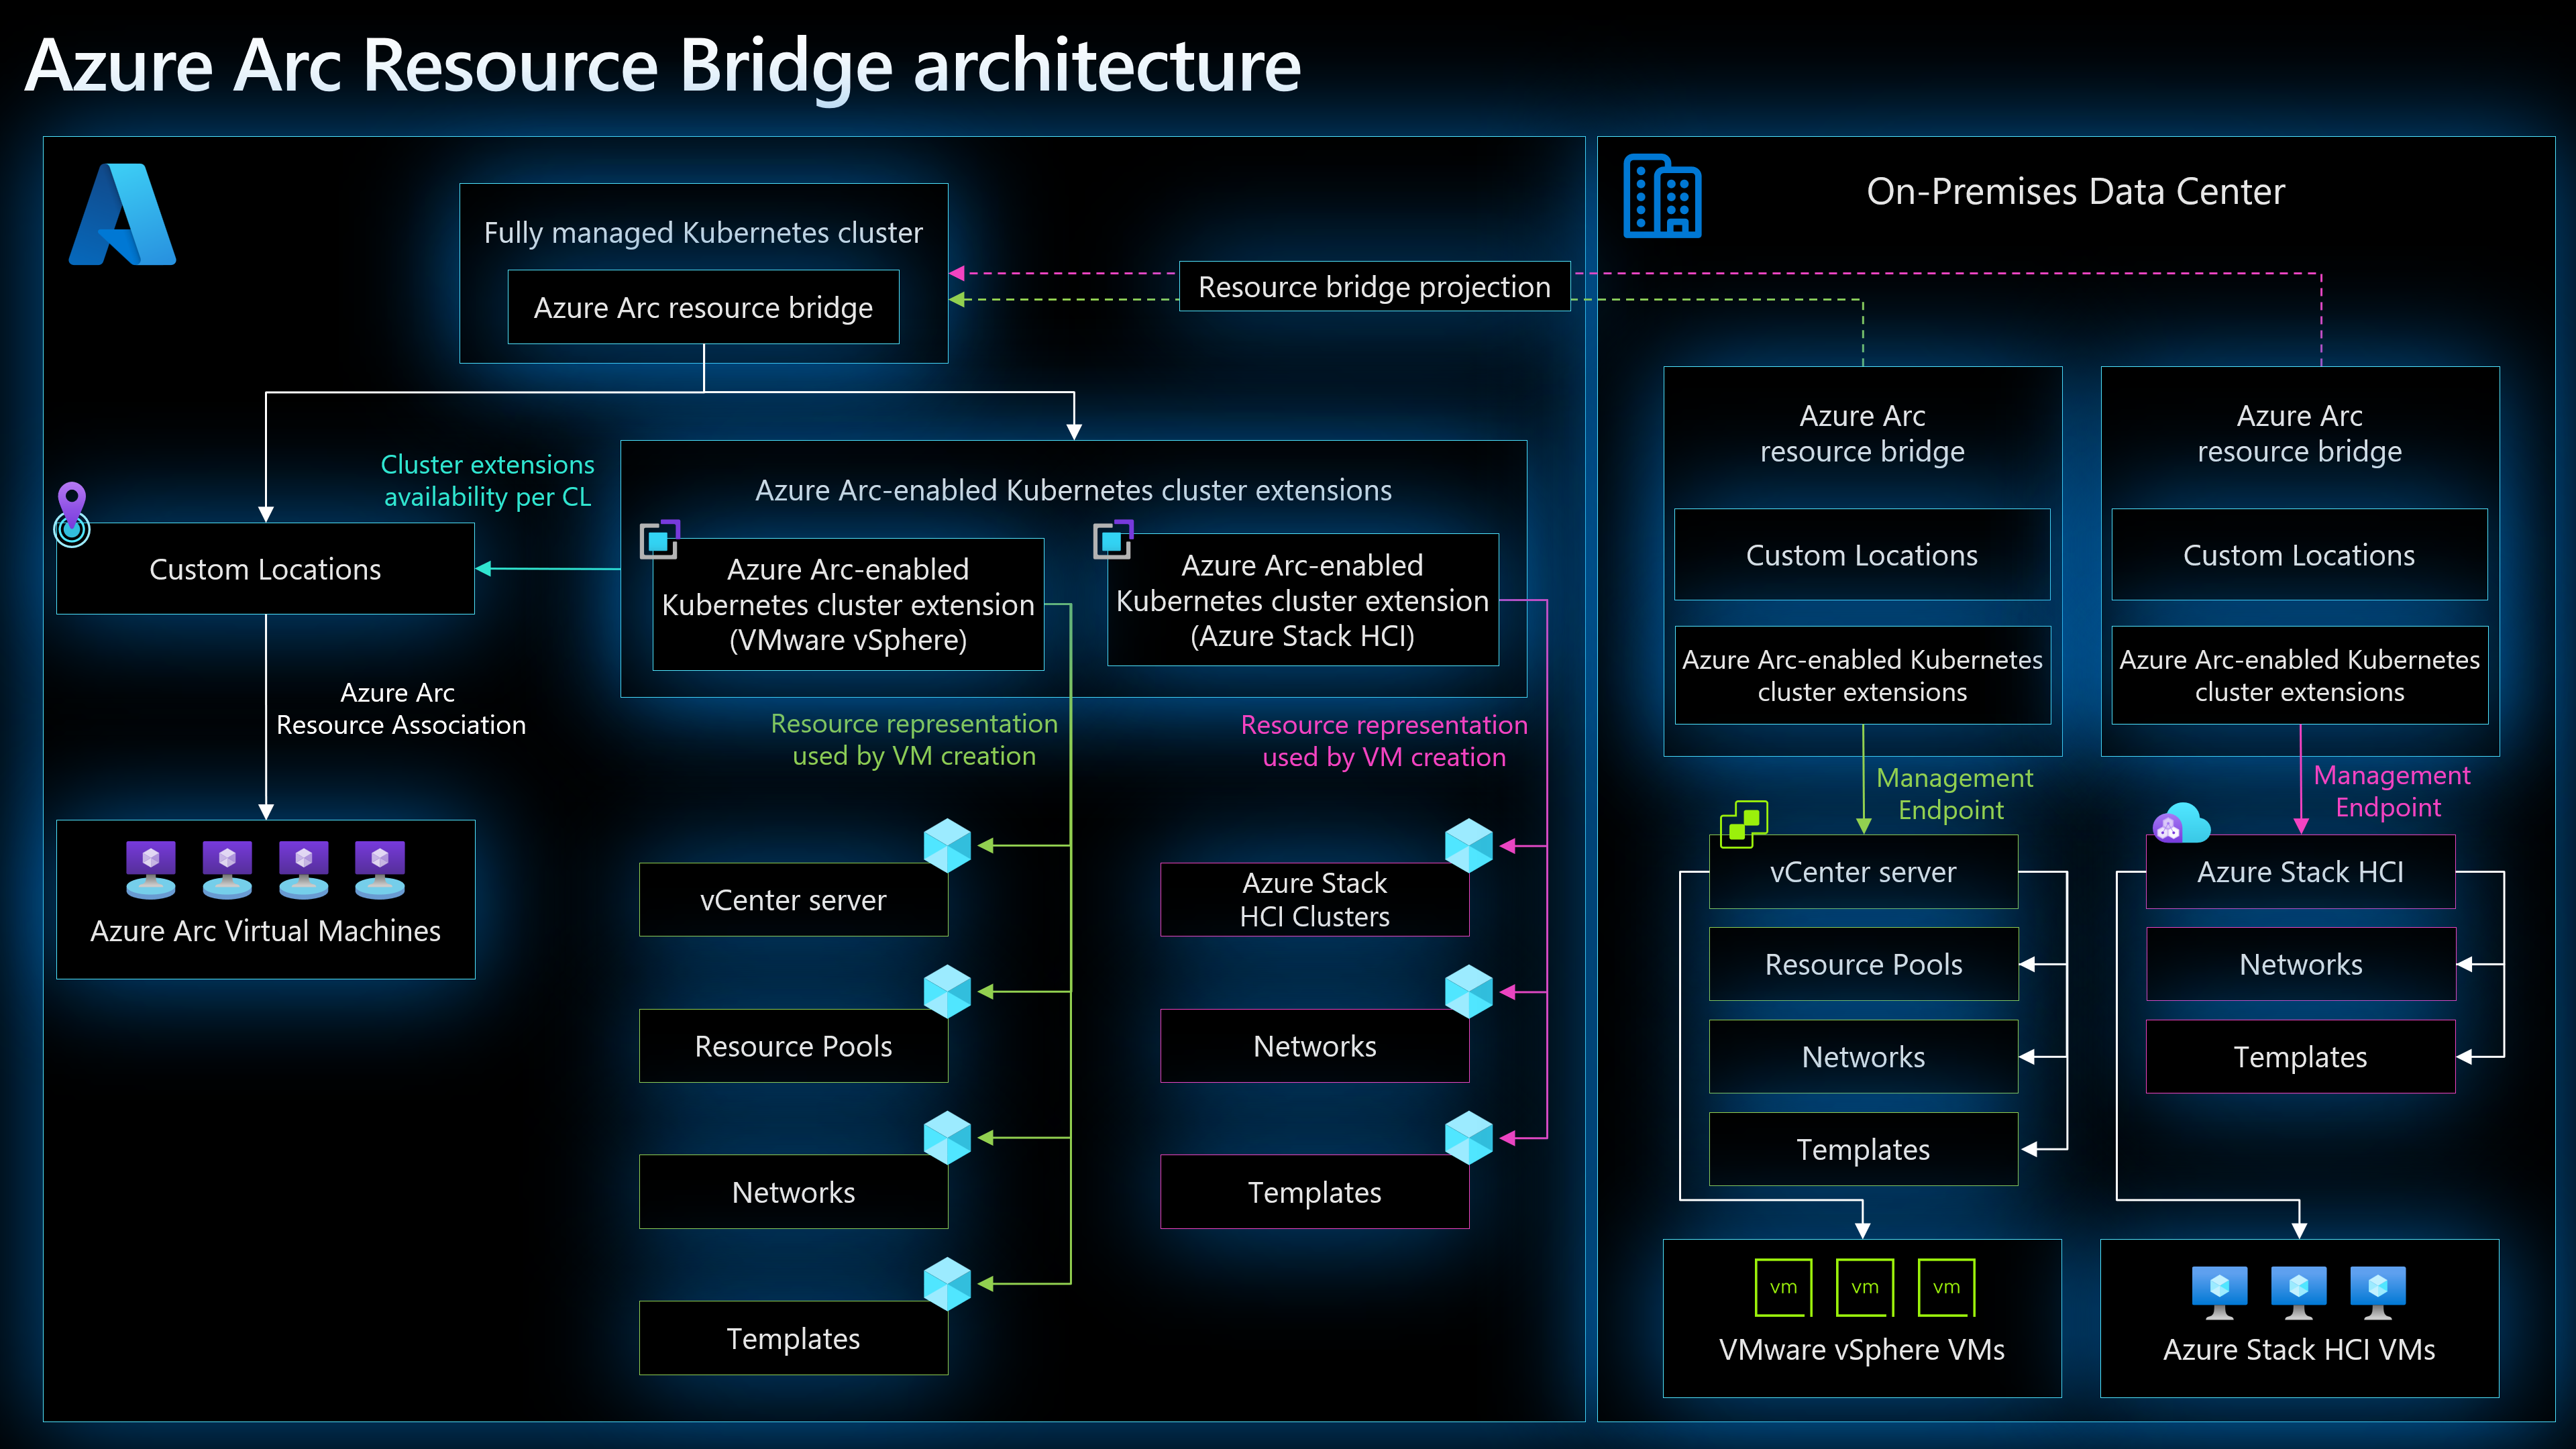
The diagrams demonstrate the relationship between the layers of the Arc Resource Bridge and the Azure services it supports. Special thanks to Lior Kamrat for creating this detailed representation of the infrastructure in his insightful work.
Activating All Available Features in Azure Local
After provisioning Azure Local, you may notice that many features are not enabled by default. We’ll walk through the activation process for these features to unlock the full potential of your HCI environment.
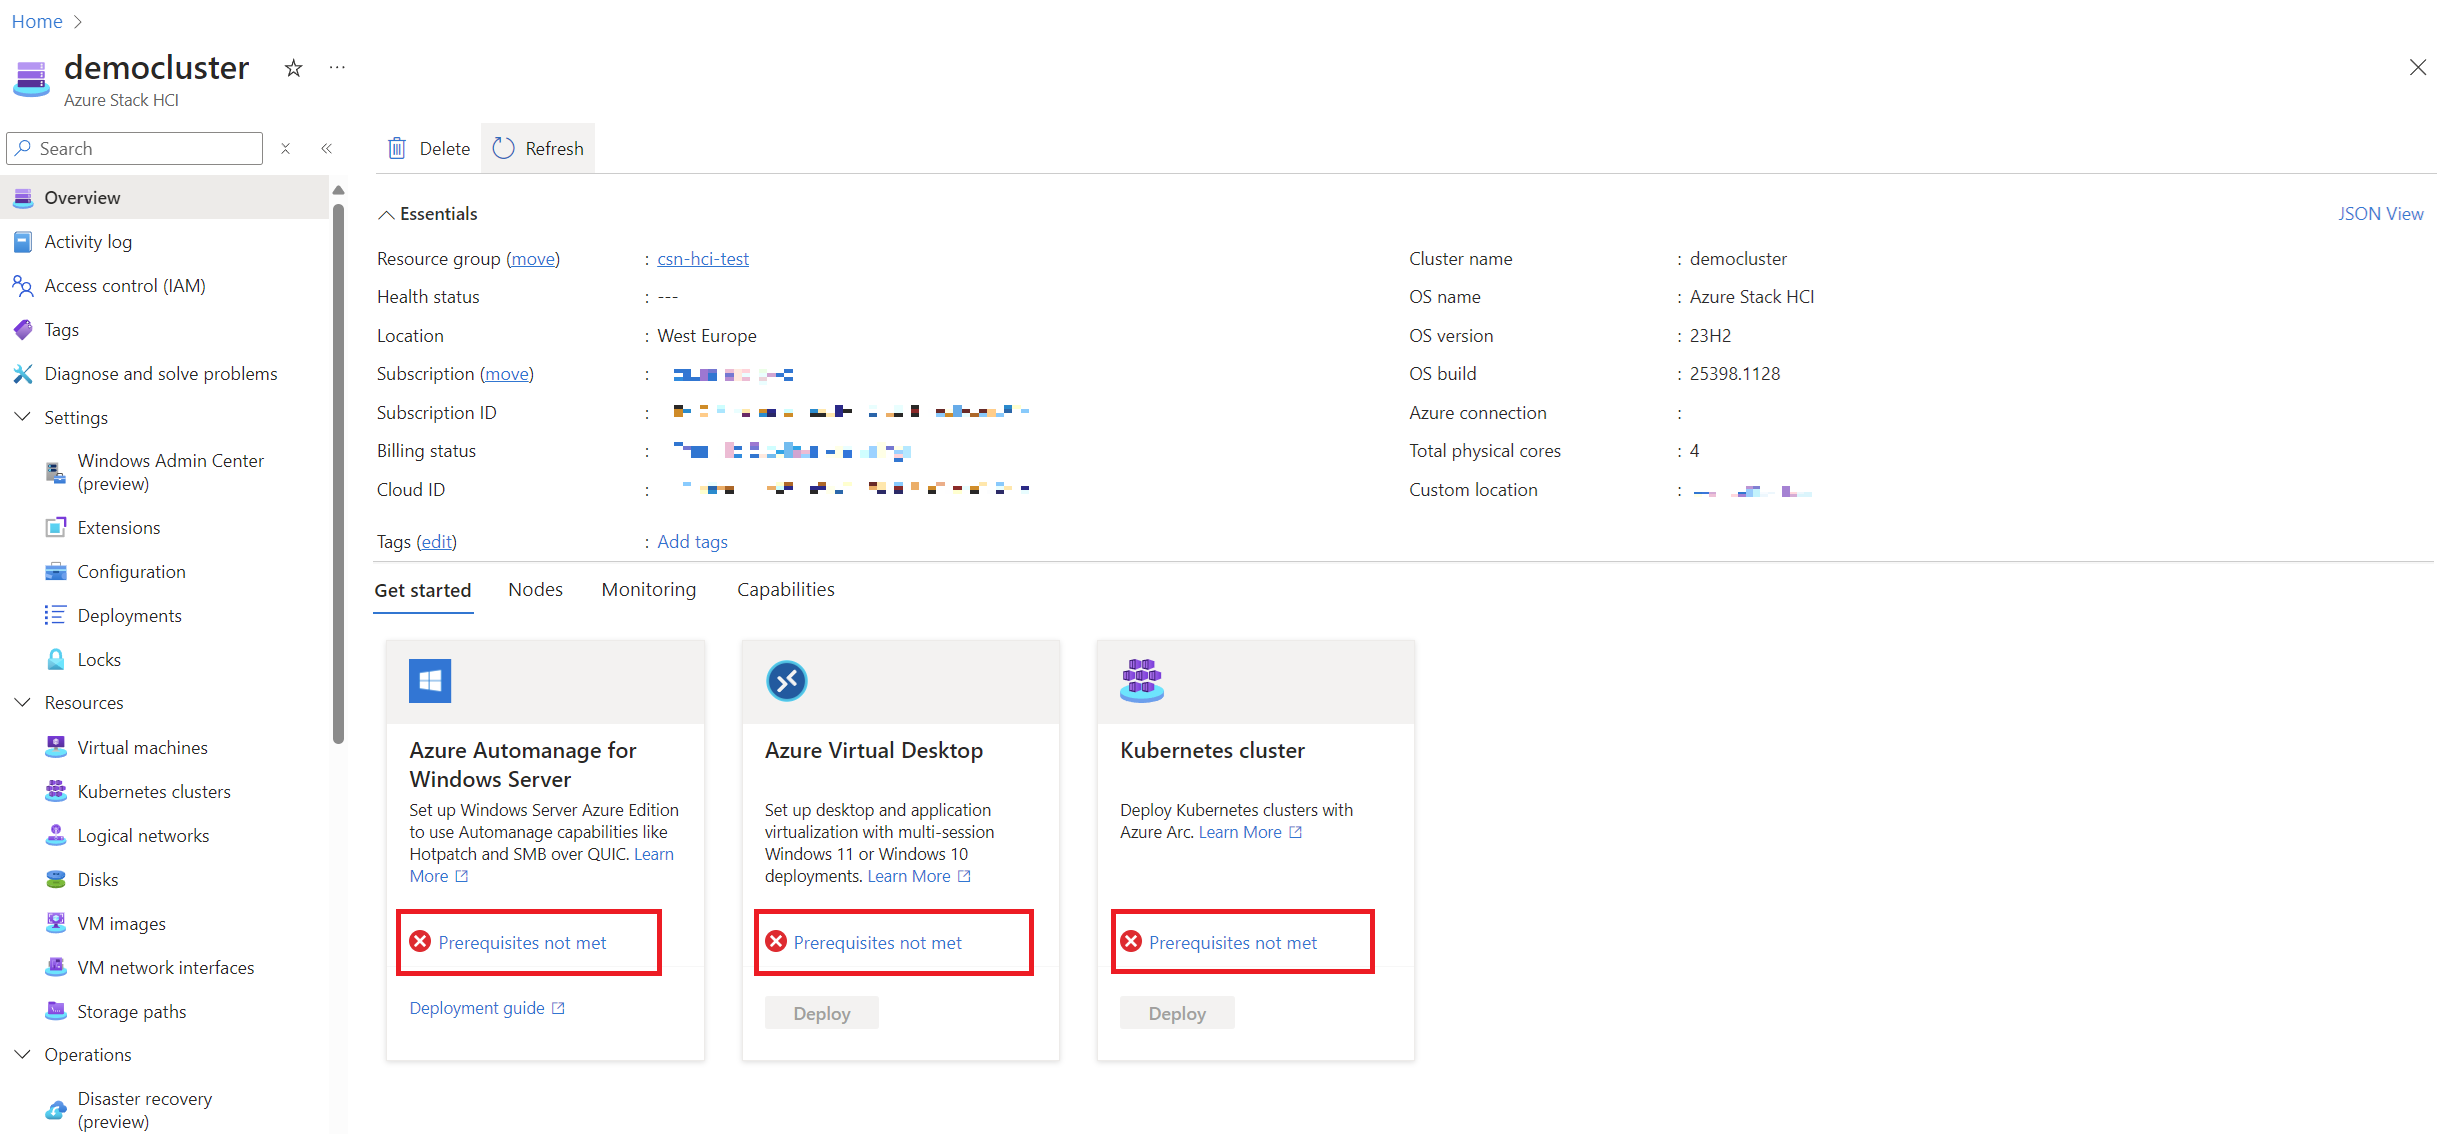
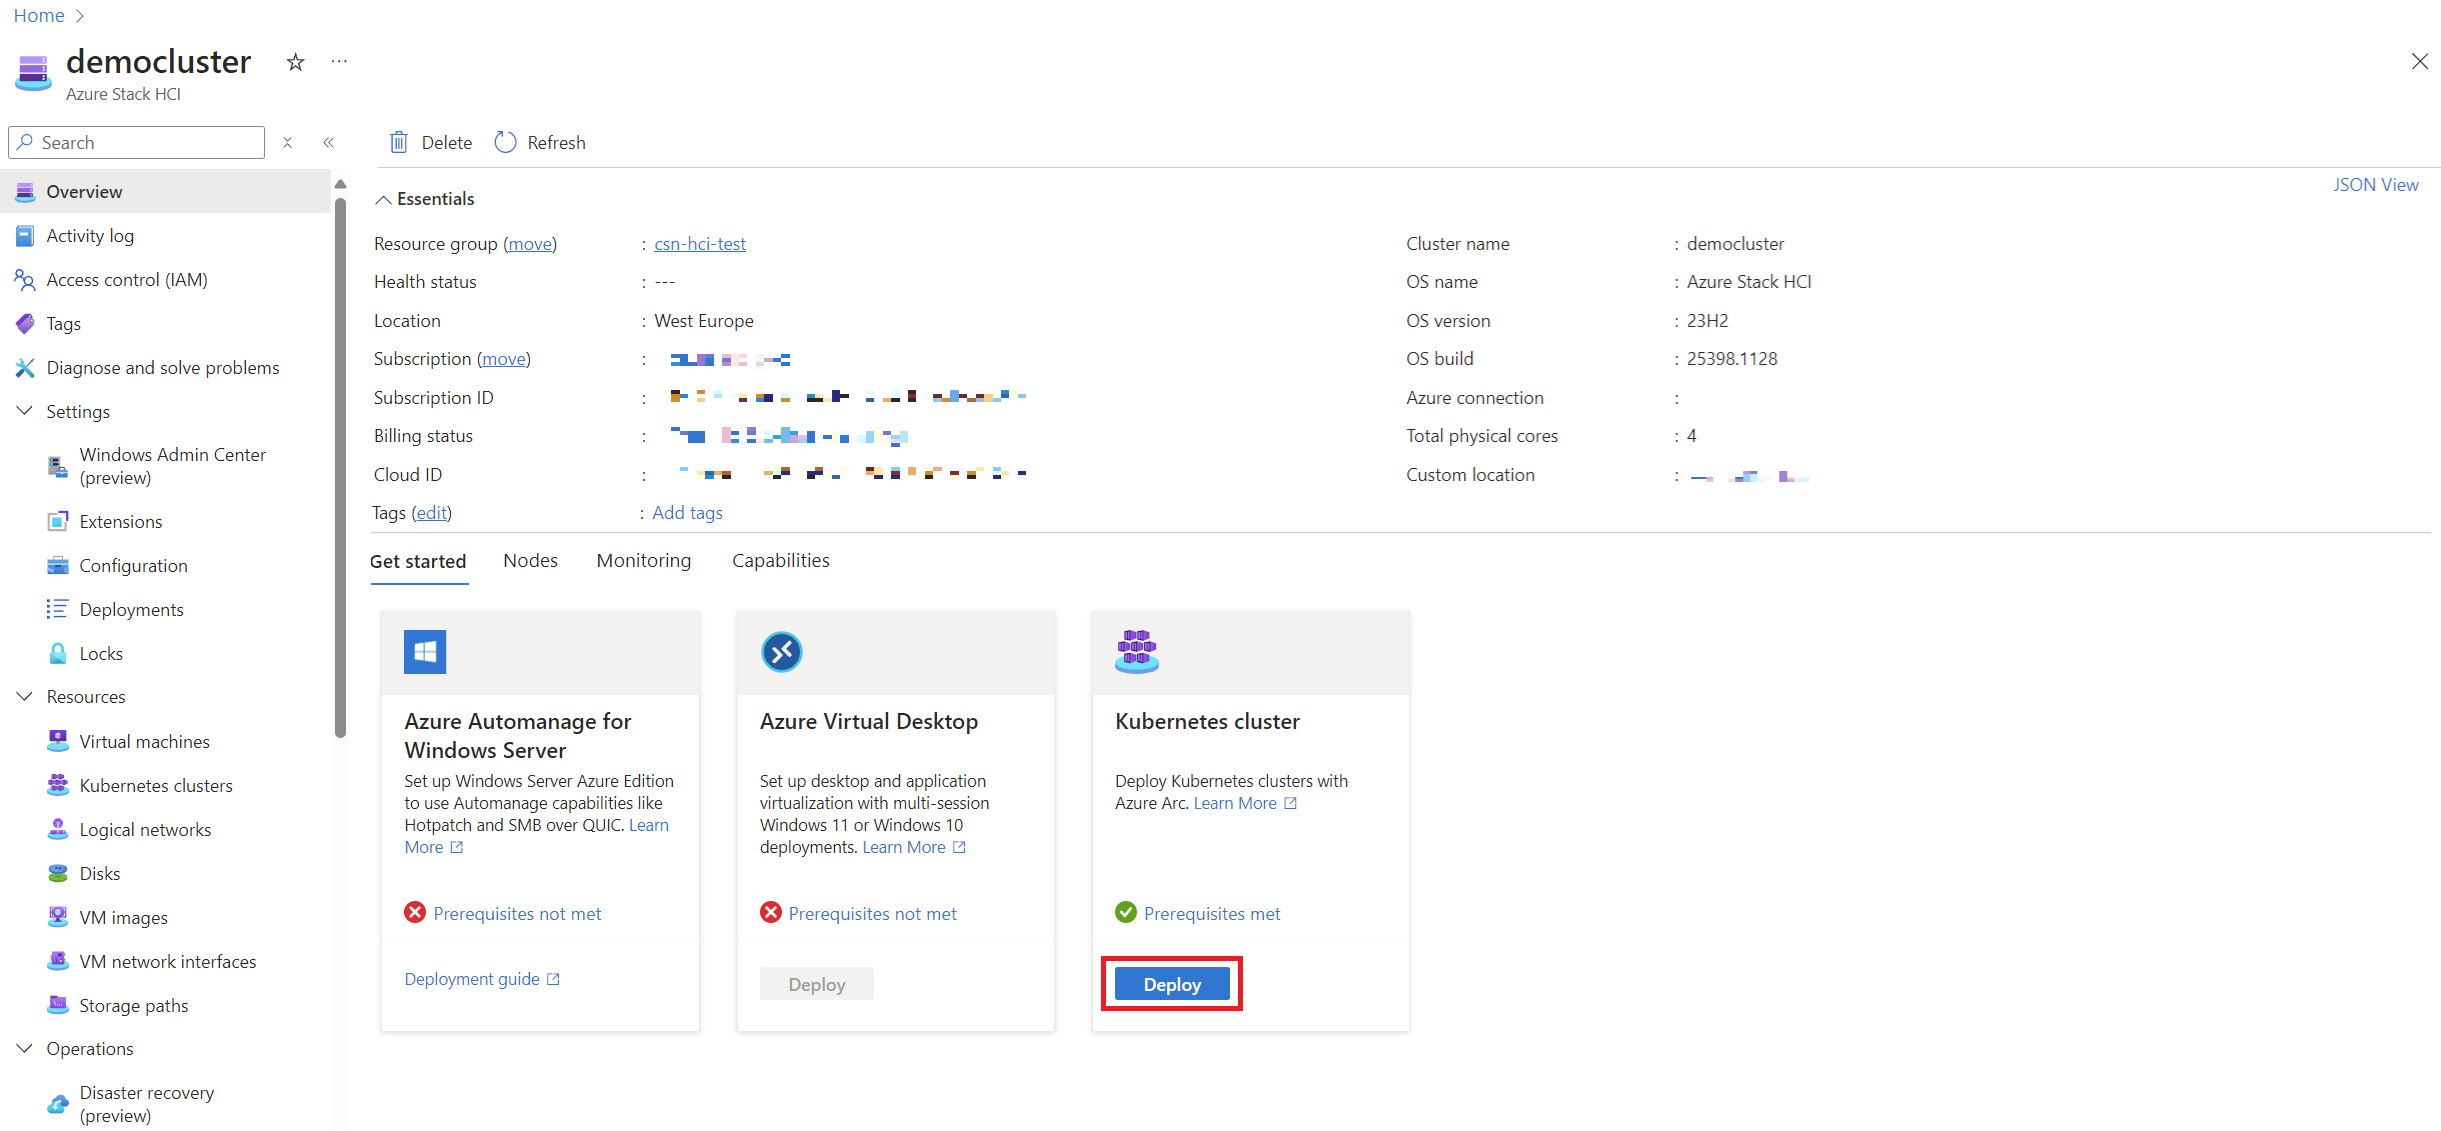
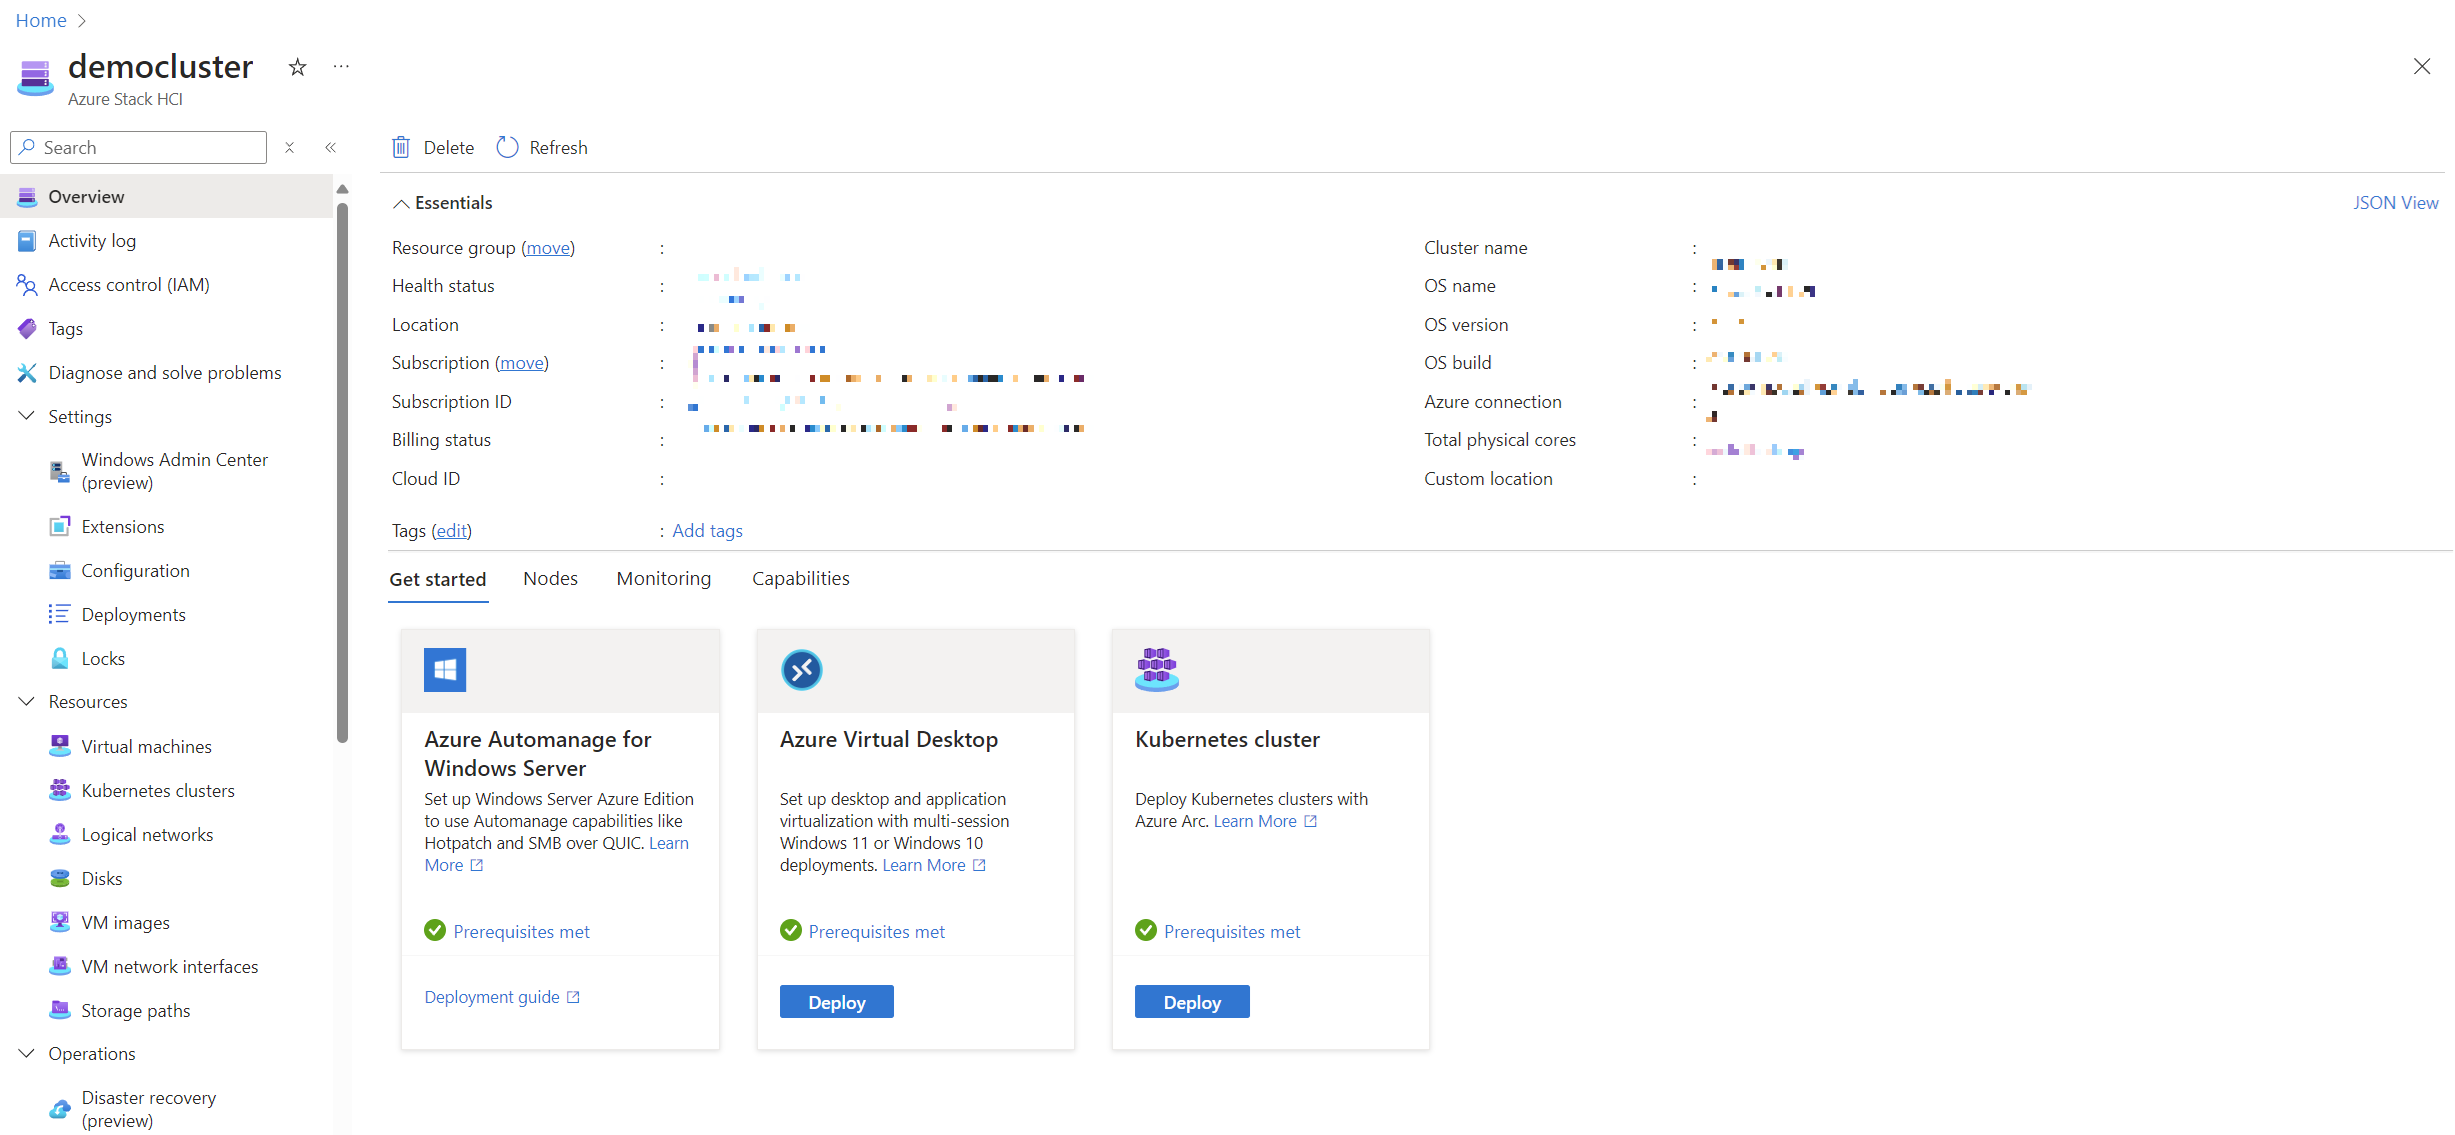
Here’s a look at the Azure Local environment immediately after deployment:
As you can see, most features need to be activated to fully utilize Azure Local’s capabilities. Let’s go through each step.
Creating a Logical Network
To start deploying services like AKS or VMs, you must first create a logical network. In the past, this required direct access to the cluster, but the process has become more straightforward in recent Azure Local versions. The Microsoft documentation on this topic is outdated; currently, instead of manually typing the name of the virtual switch (which in the past was obtained by directly accessing the cluster node and executing the following command Get-VmSwitch -SwitchType External), now, you select it from a dropdown menu 👌.
Here is a small guide on how to configure the logical network in our demolab:
-
First we will go to the Logical Network section and add our first lnet:
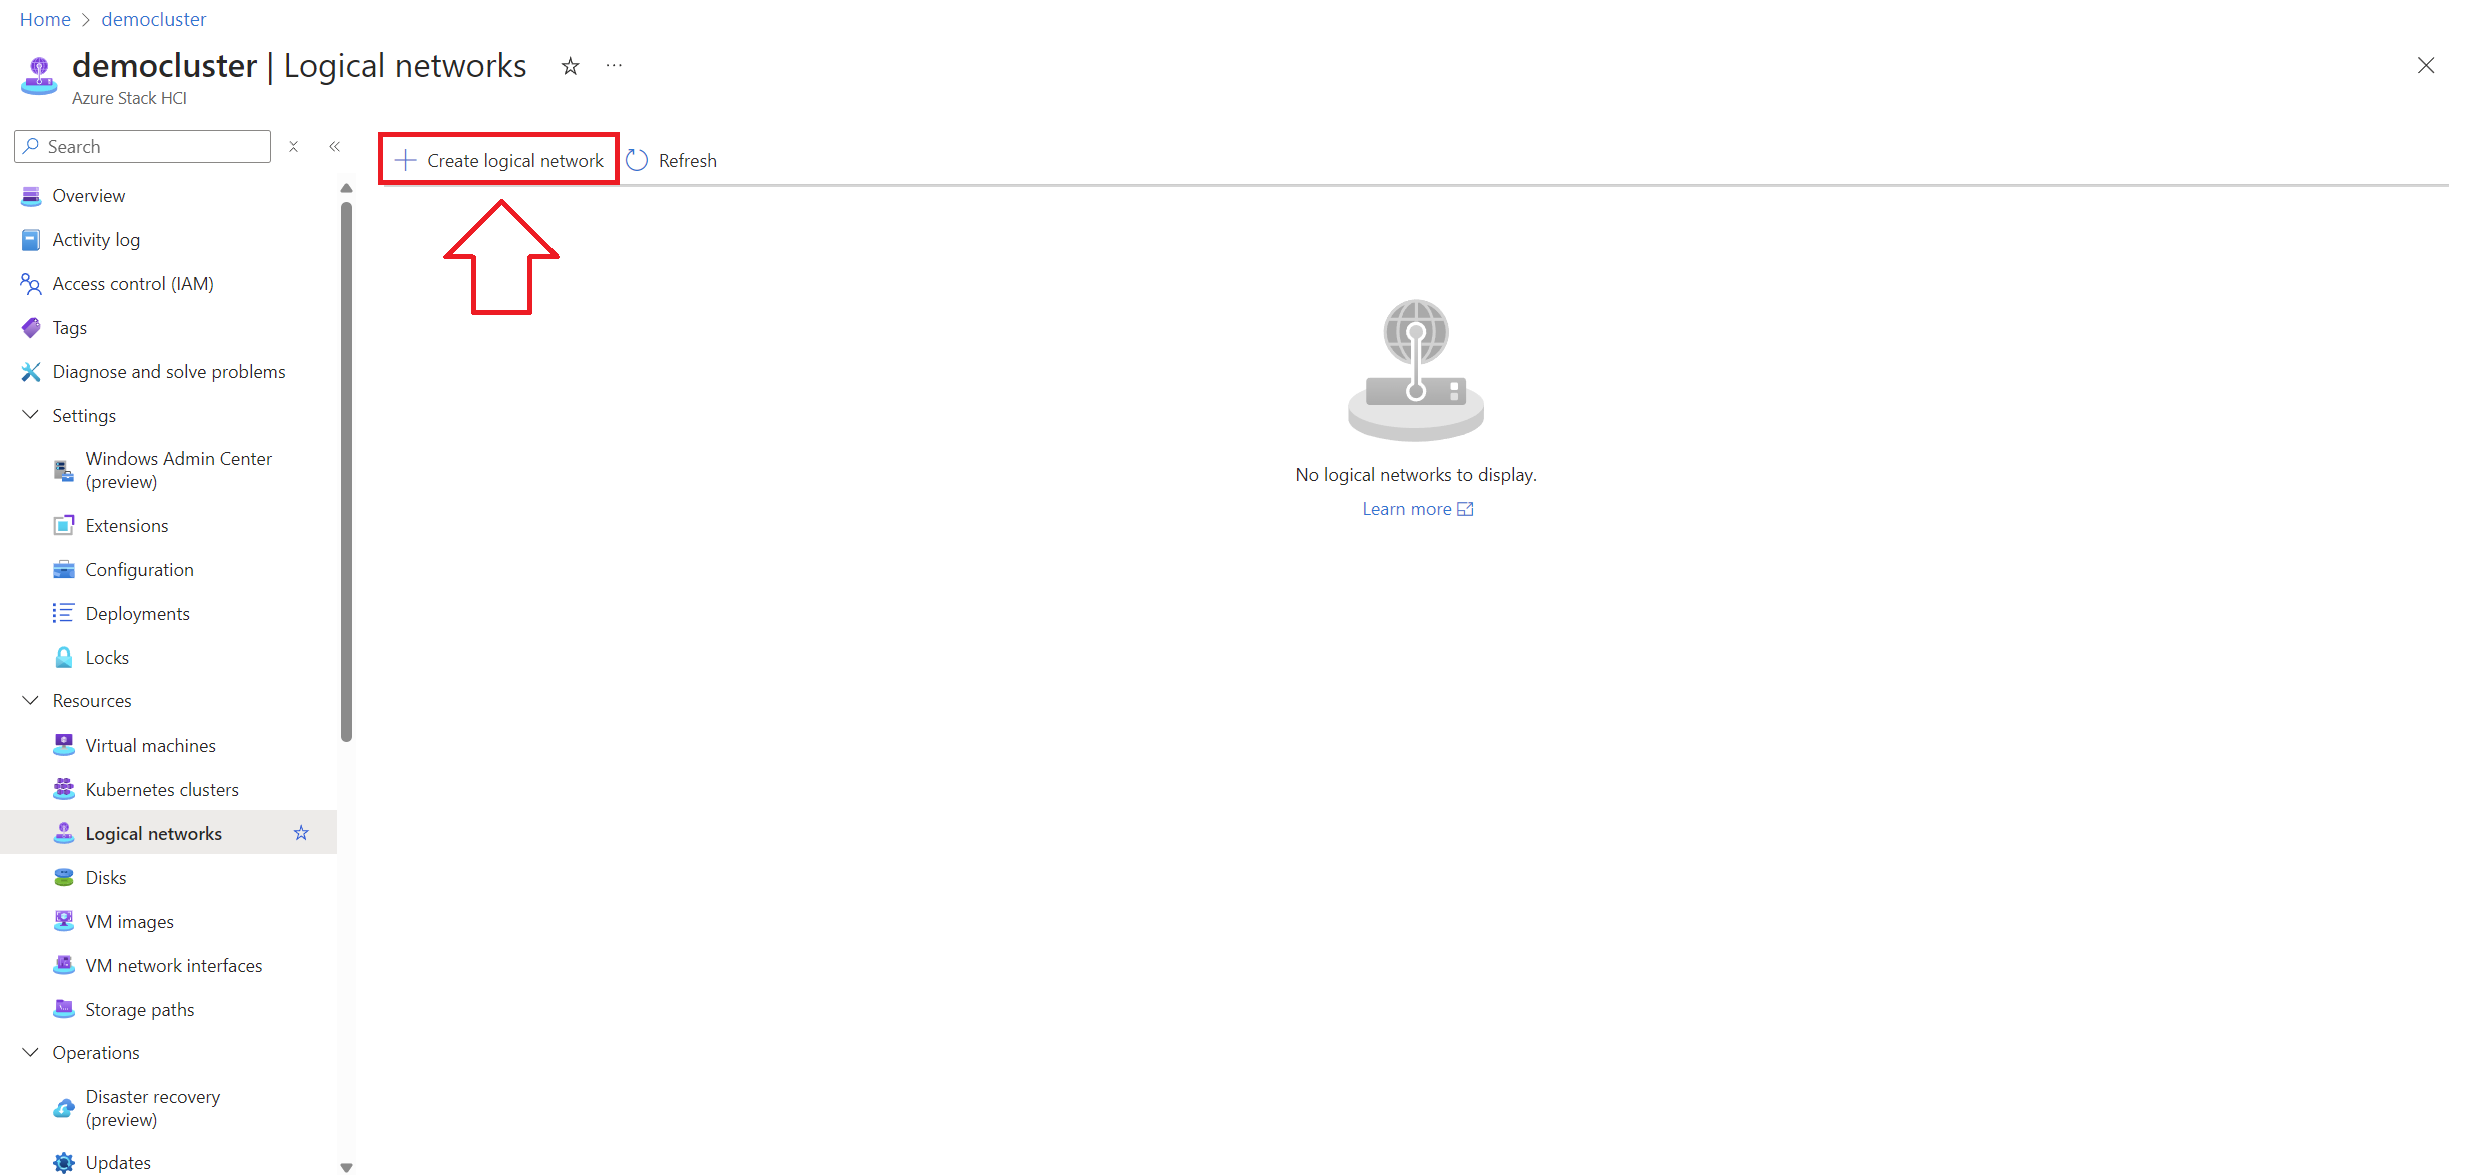
-
We give a name to the lnet (which will appear later in Azure) and select the Virtual Switch using Dropdown:
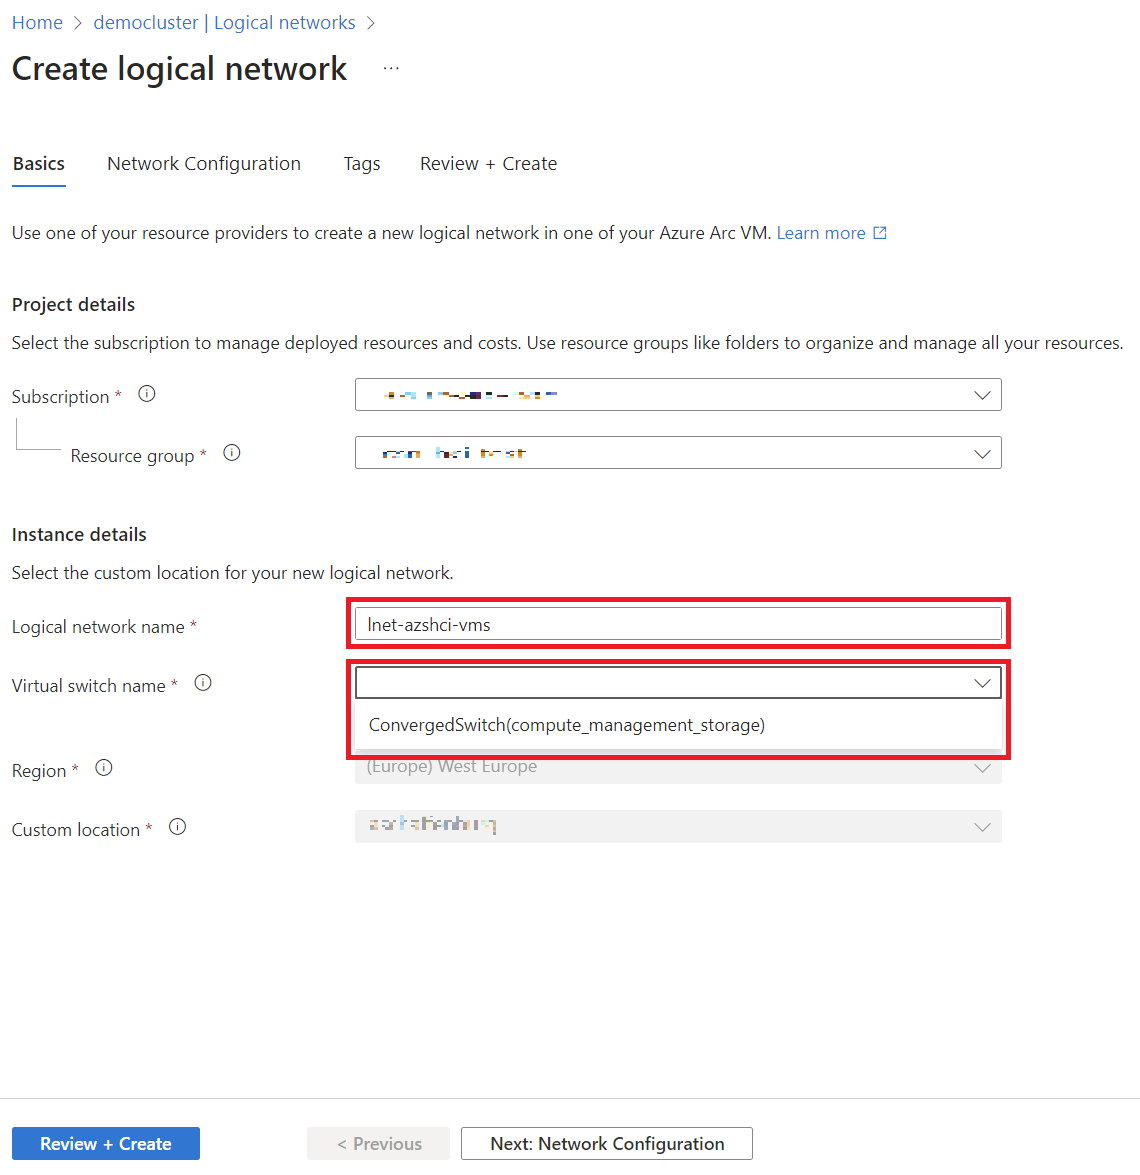
-
And finally we add all the necessary network data. If you have made use of Demolab you can use the same as me 😉
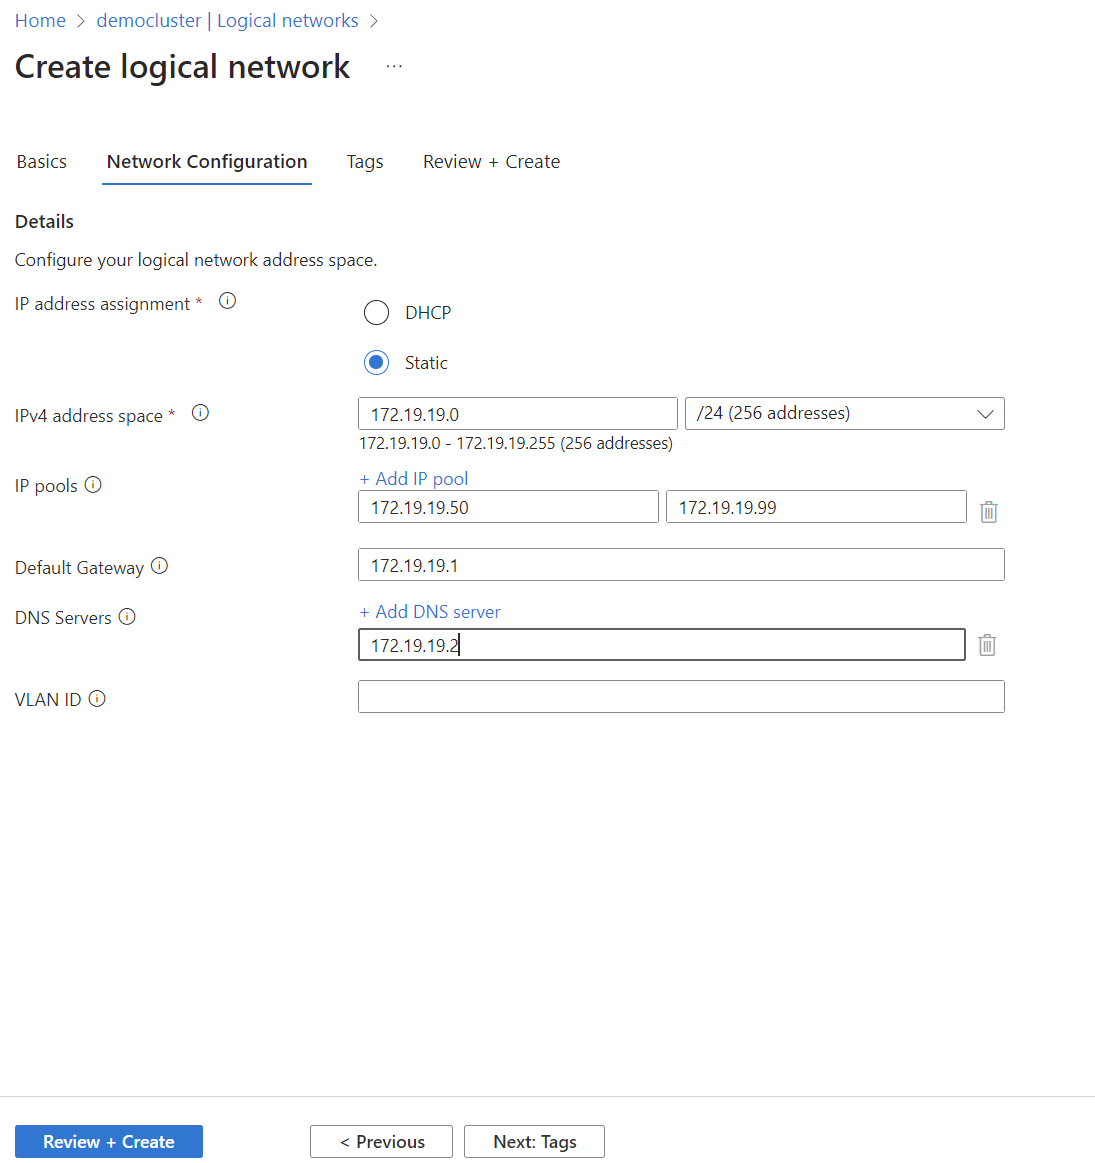
Once you’ve created your first Logical Network (lnet), you can deploy an AKS 🤖. But we will leave this point for another article because several considerations must be taken into account.
However, keep in mind that VMs and Azure Automanage for Windows Server still cannot be deployed at this point, as they depend on custom VM images, which we will address later.
Windows Admin Center (WAC)
Windows Admin Center (WAC) was a key management tool for Azure Local, providing a centralized interface to manage servers, clusters, and virtual machines. It streamlined tasks like monitoring, updating, and troubleshooting, making it an important tool for administrators. There are two main versions of WAC available for Azure Local: local and cloud-based, each with specific advantages.
Local WAC
Local WAC is the stable, fully functional version that runs on a dedicated management server or VM within your environment. It requires a connection to Active Directory and direct access to your Azure Local cluster. In previous versions (22H2) of Azure Local, Local WAC was crucial for tasks like firmware and hardware updates, which relied heavily on plugins. These plugins were essential for managing hardware from specific OEM vendors, providing deep integration for updates and monitoring.
However, starting with Azure Local version 23H2, the responsibility for managing firmware and hardware updates has largely shifted to the Solution Builder Extensions (SBE). The goal moving forward is to manage everything from the Azure portal, or at least get as close to that as possible. I’ll dive deeper into the specifics of this shift and how updates are handled in a future article focused on the update process.
Azure Arc-based WAC
Azure Arc-based WAC is currently in preview and built on EntraID (formerly Azure Active Directory). Unlike Local WAC, it doesn’t require an Active Directory connection or direct access to the cluster. Instead, it routes connections through Azure, which acts as an intermediary, similar to how TeamViewer works. This simplifies remote management by removing the need to open ports manually. Although the Arc-based version represents the future of hybrid cloud management, it’s still in preview and can be unstable. The goal is to eventually manage everything via the Azure portal, and Arc-based WAC is a step toward that future, though it’s not fully reliable yet.
More details on the Azure-based WAC can be found here.
Here is also a small guide on how to install and use the WAC extension in Azure:
-
In the Settings > Windows Admin Center (Preview) section. We proceed to install the extension, the port from which arc will be able to contact the cluster will be configured. Important this port is not accessible from the internet (no Port Forwarding is required), this port is only accessible to Azure in a reverse connection.
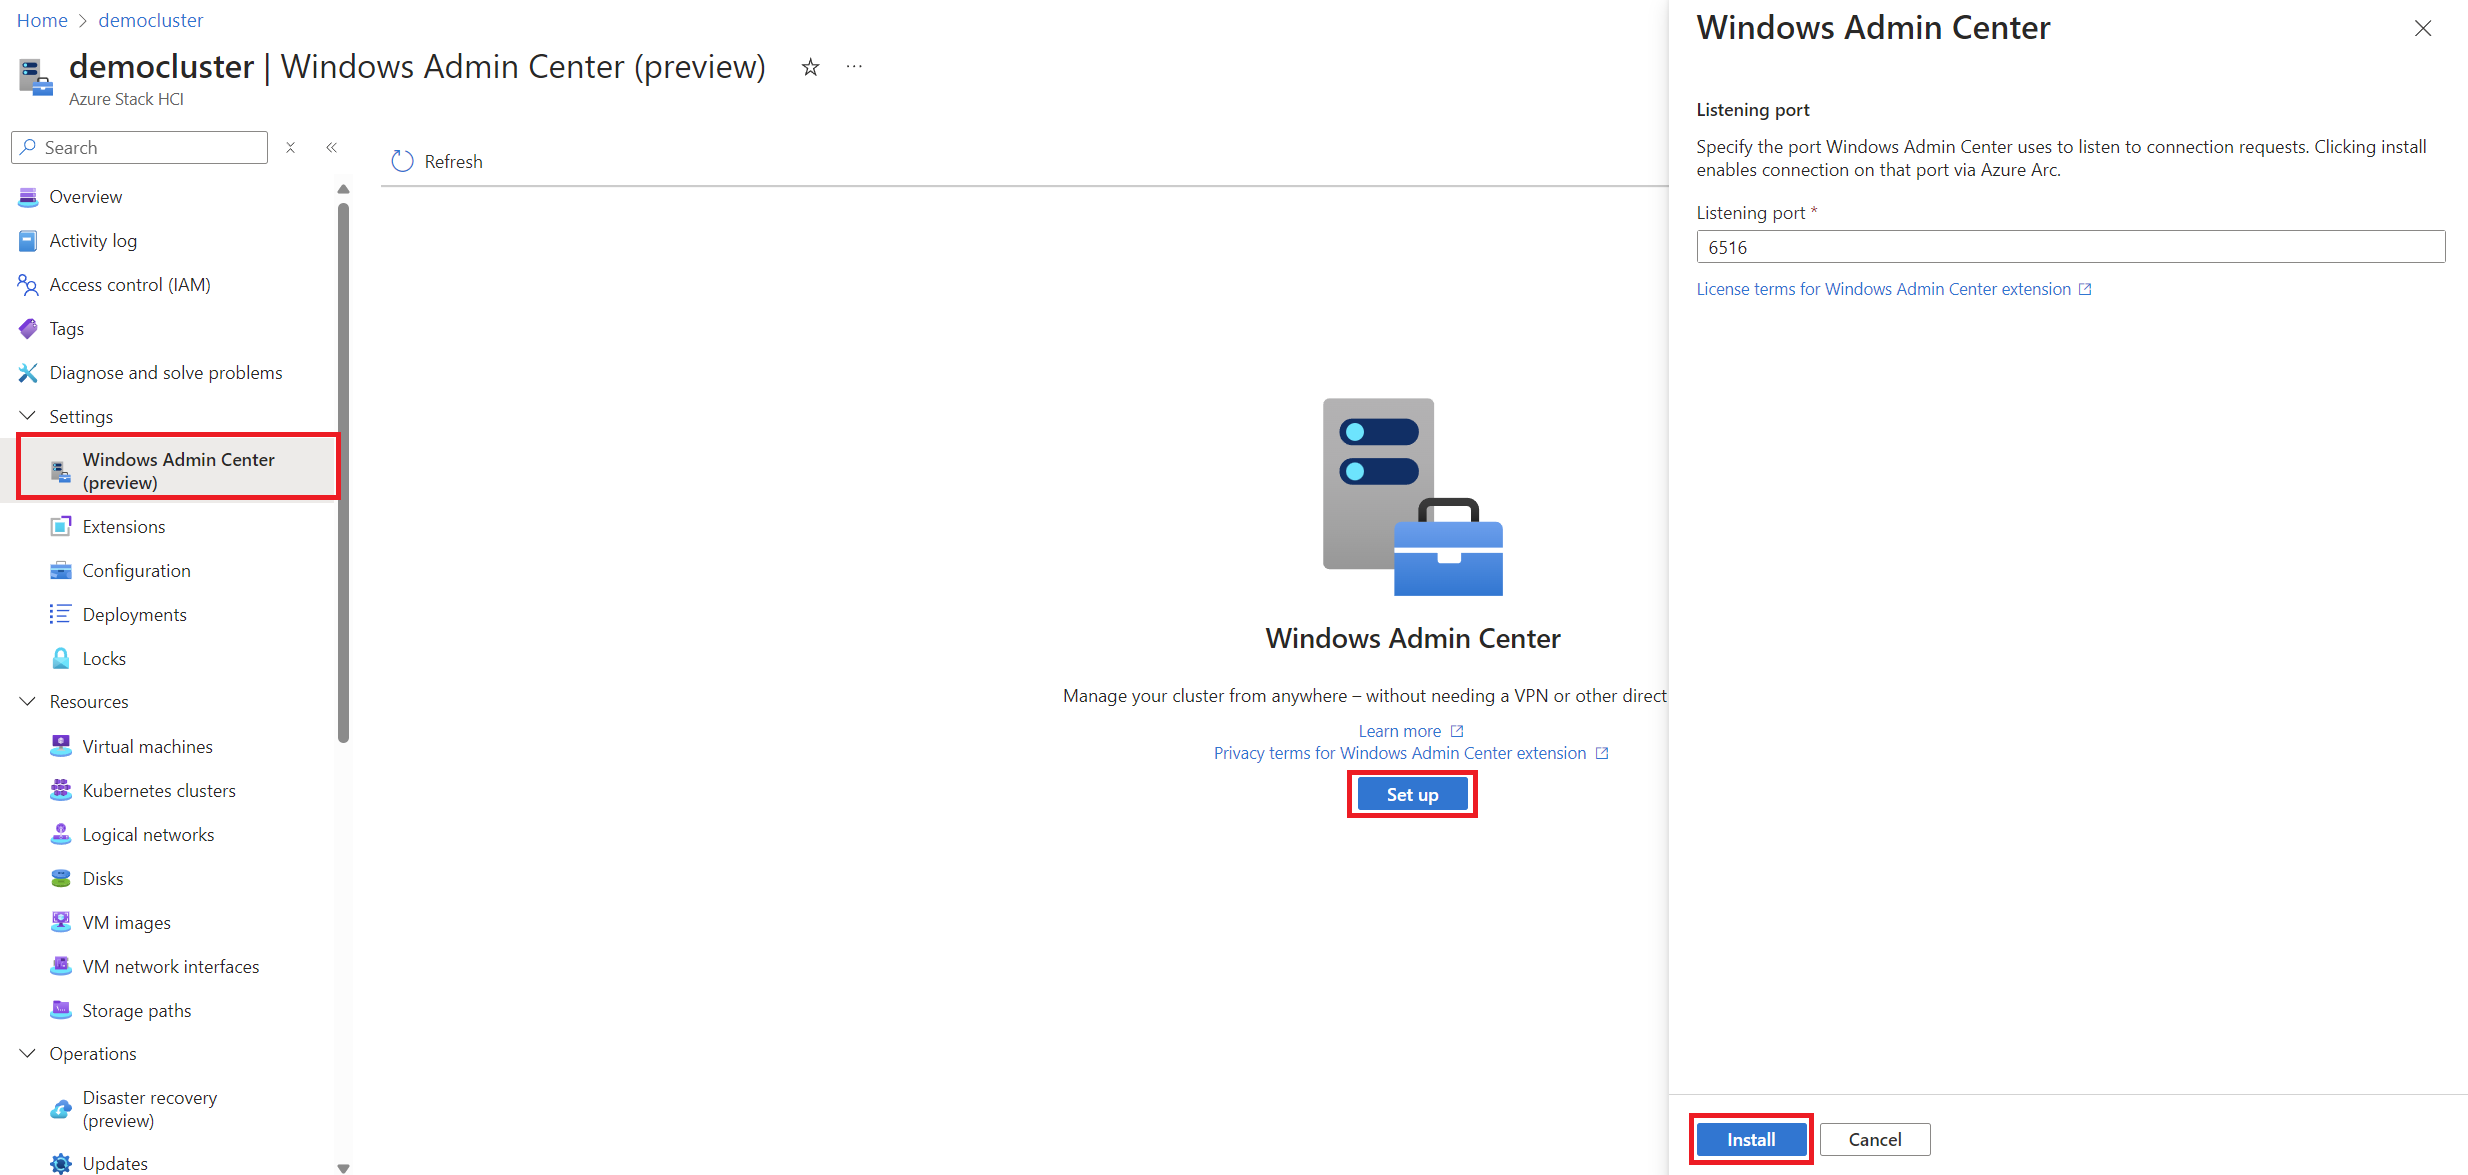
-
After a few seconds you will be able to see how the extension is being installed (This process may take a few minutes and depending on when you perform it, it may be giving certain errors):
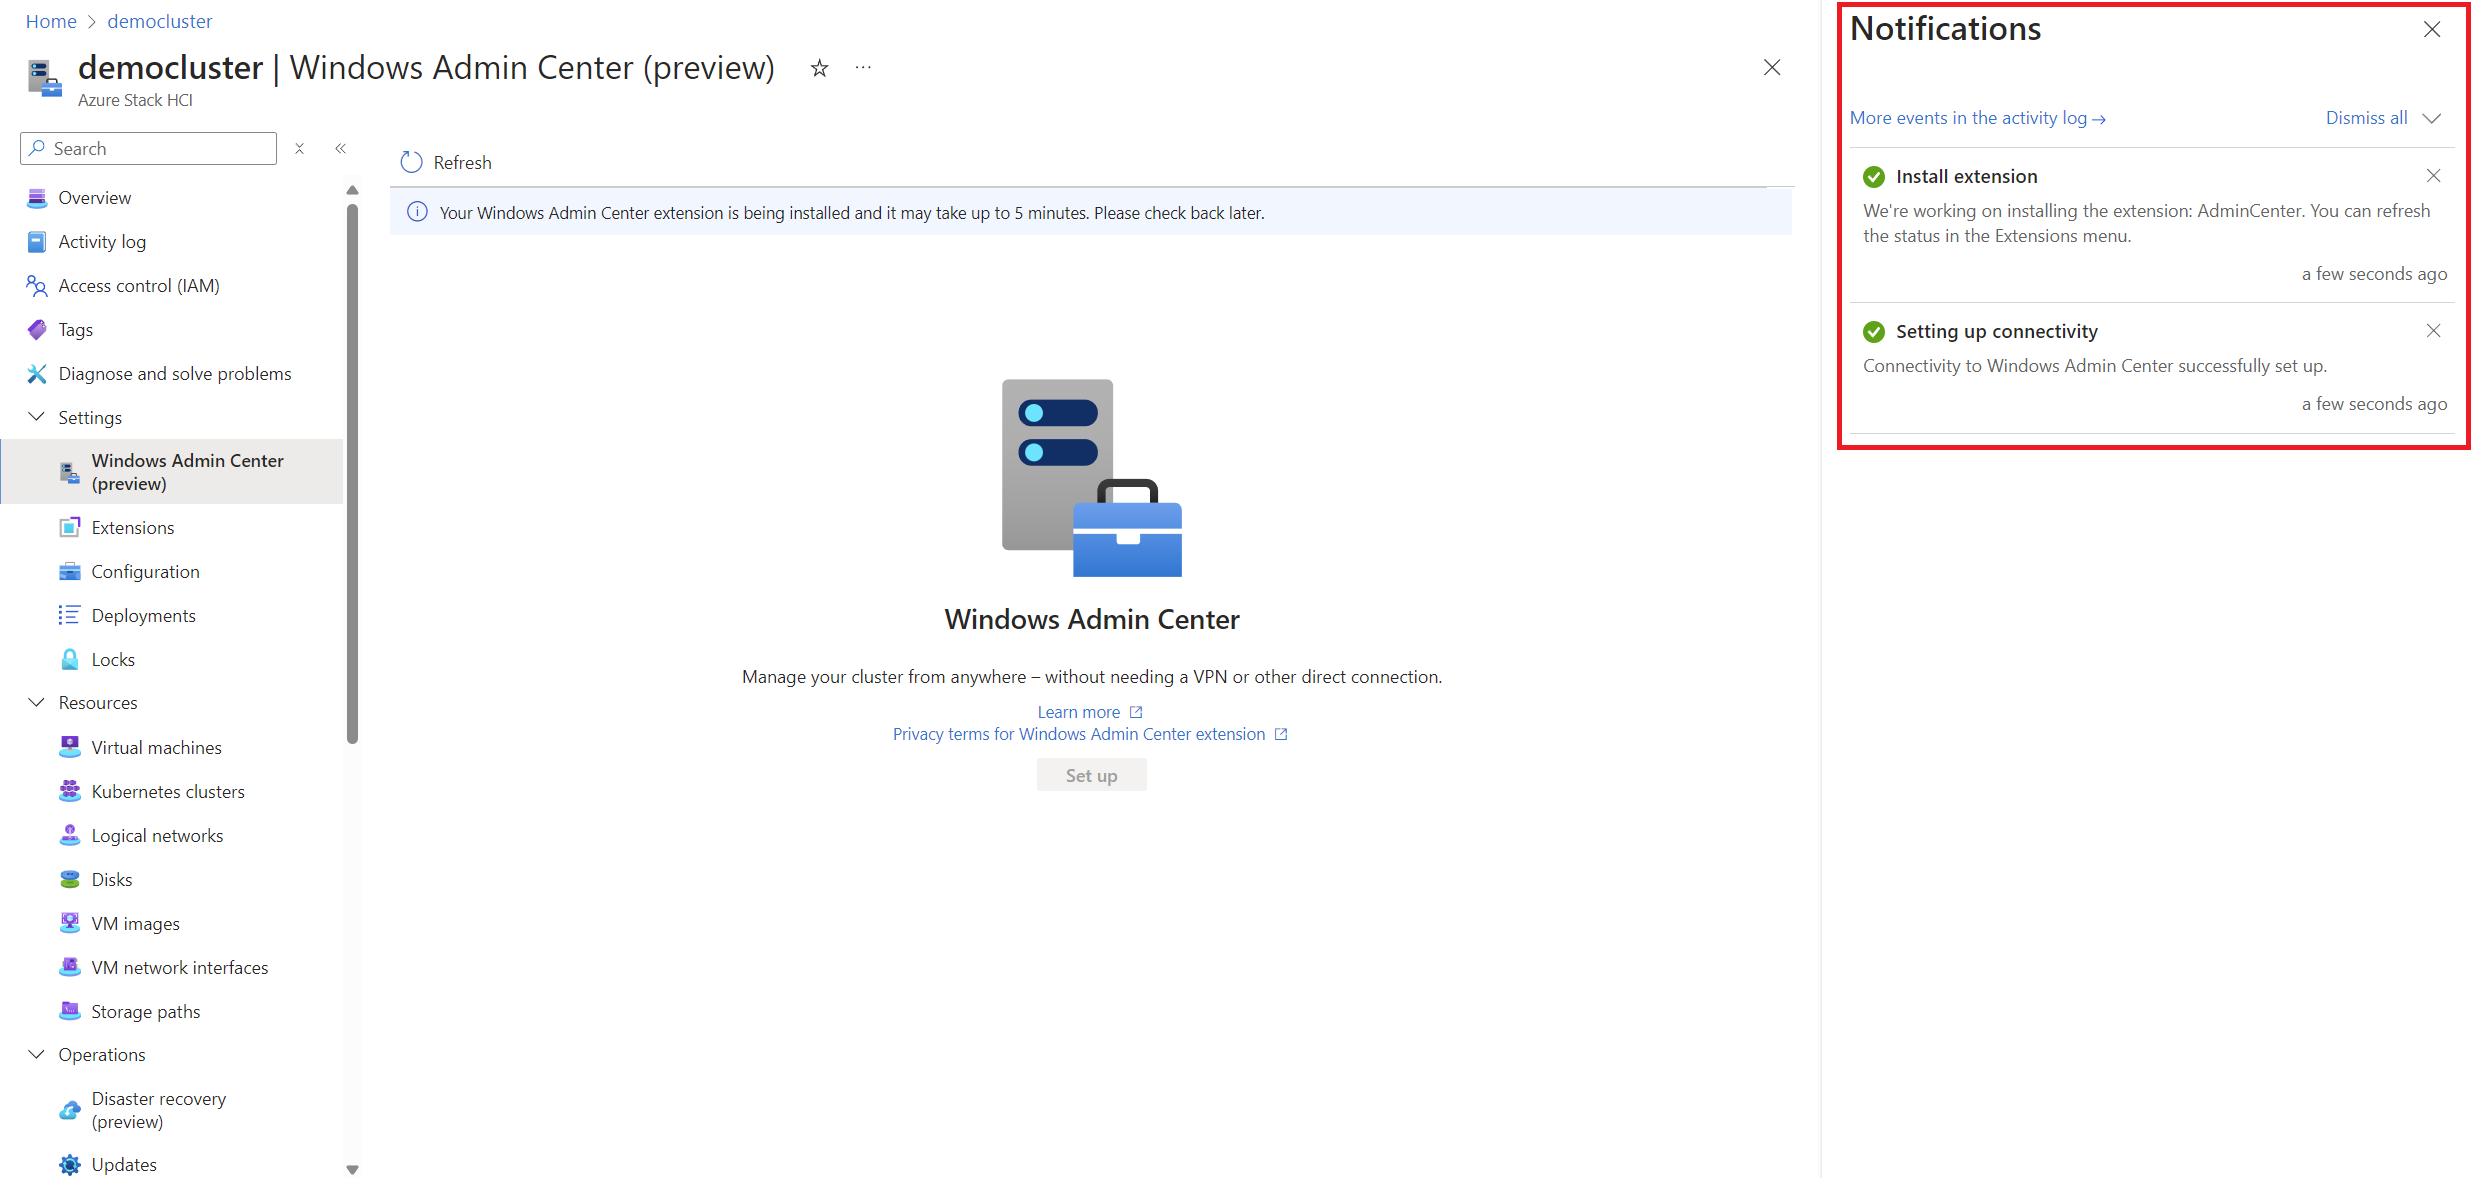
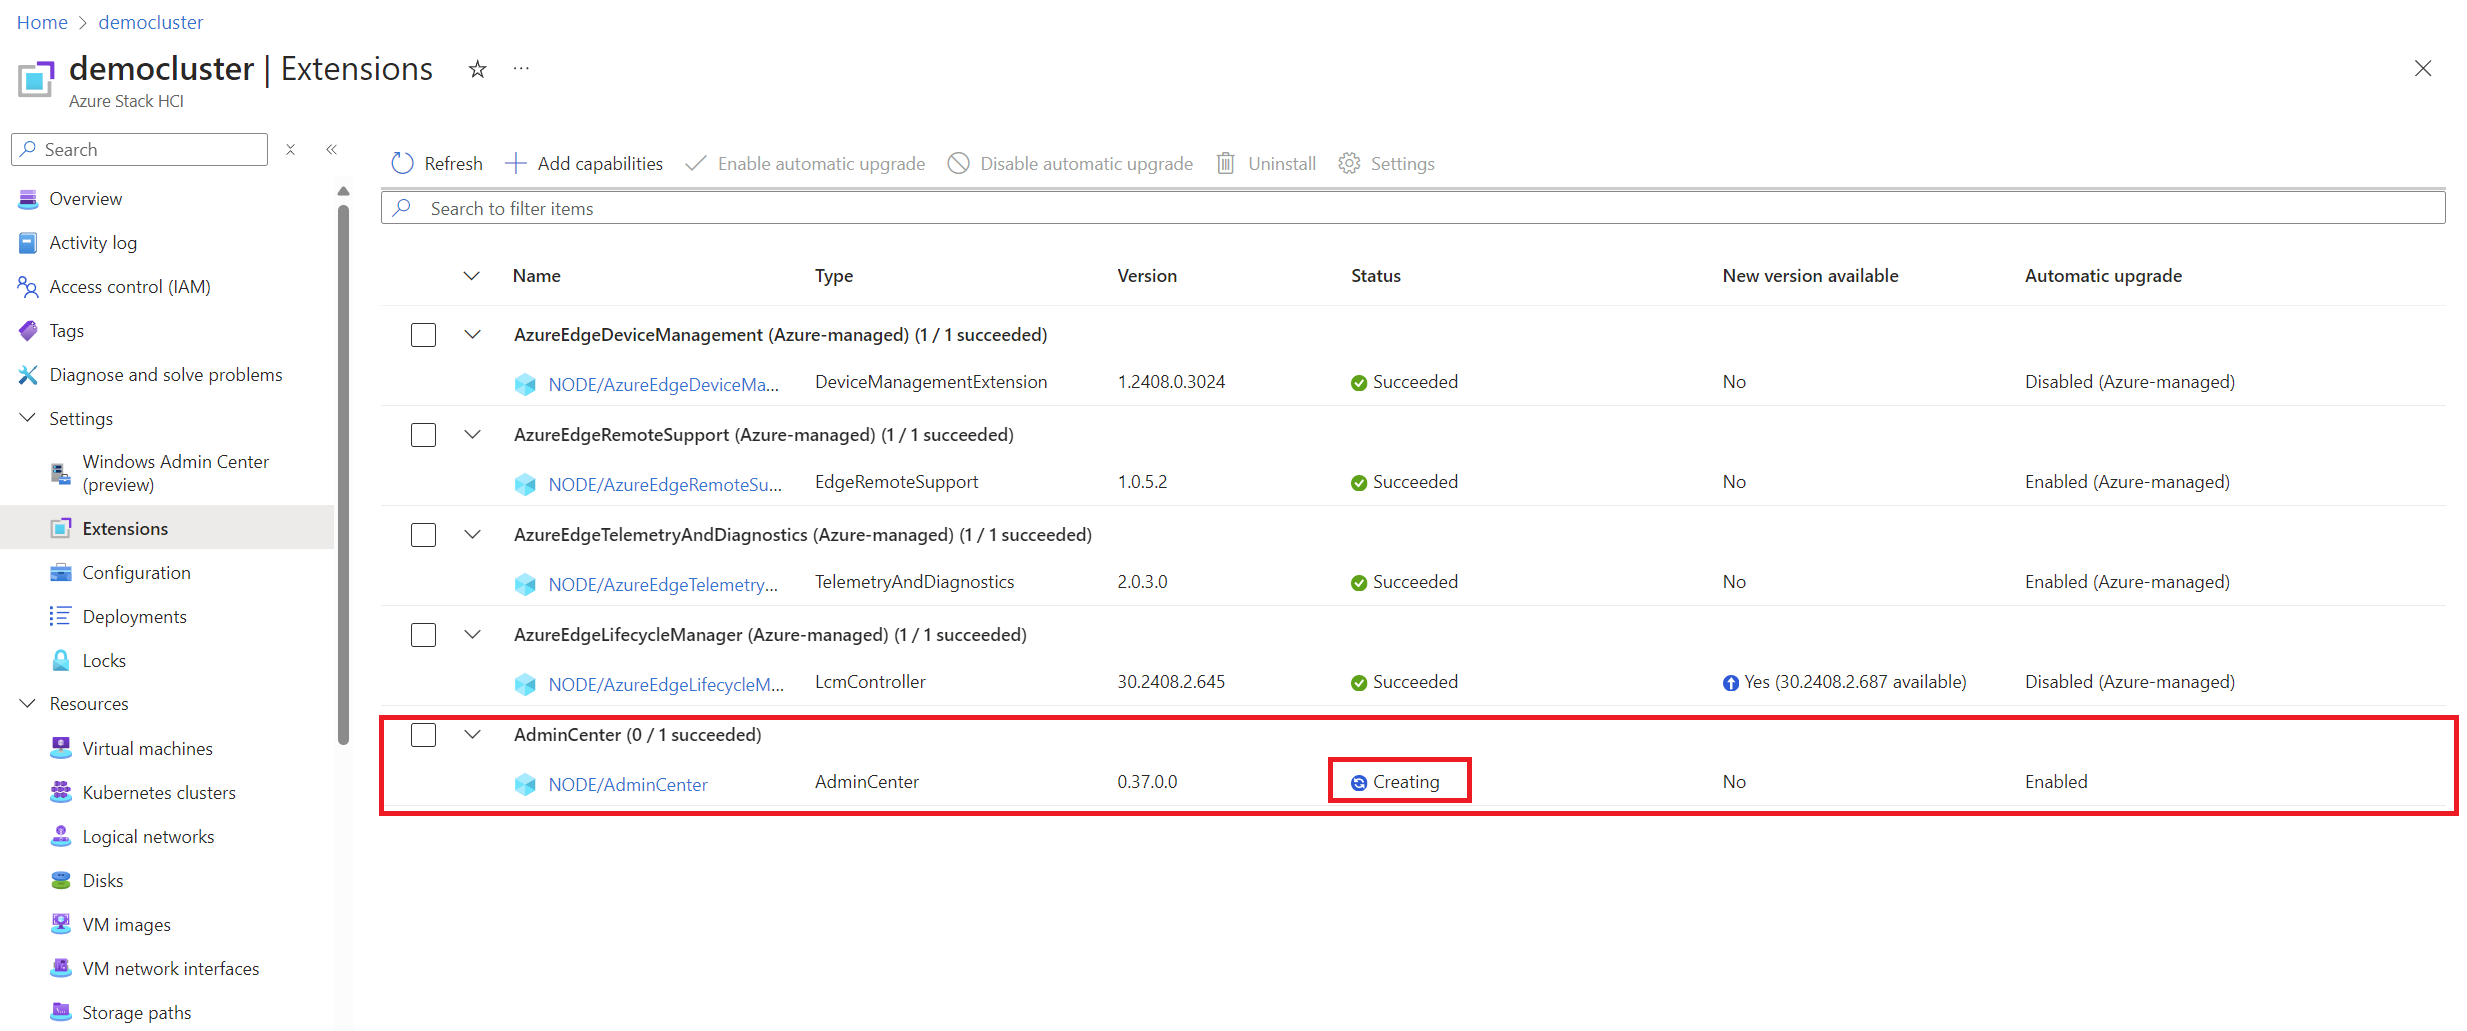
-
To access the Windows Admin Center, the following RBAC permission “Windows Admin Center Administrator Login” is required (I usually grant them in the Resource Group of the Azure Local because I usually require this right in the other resources too):
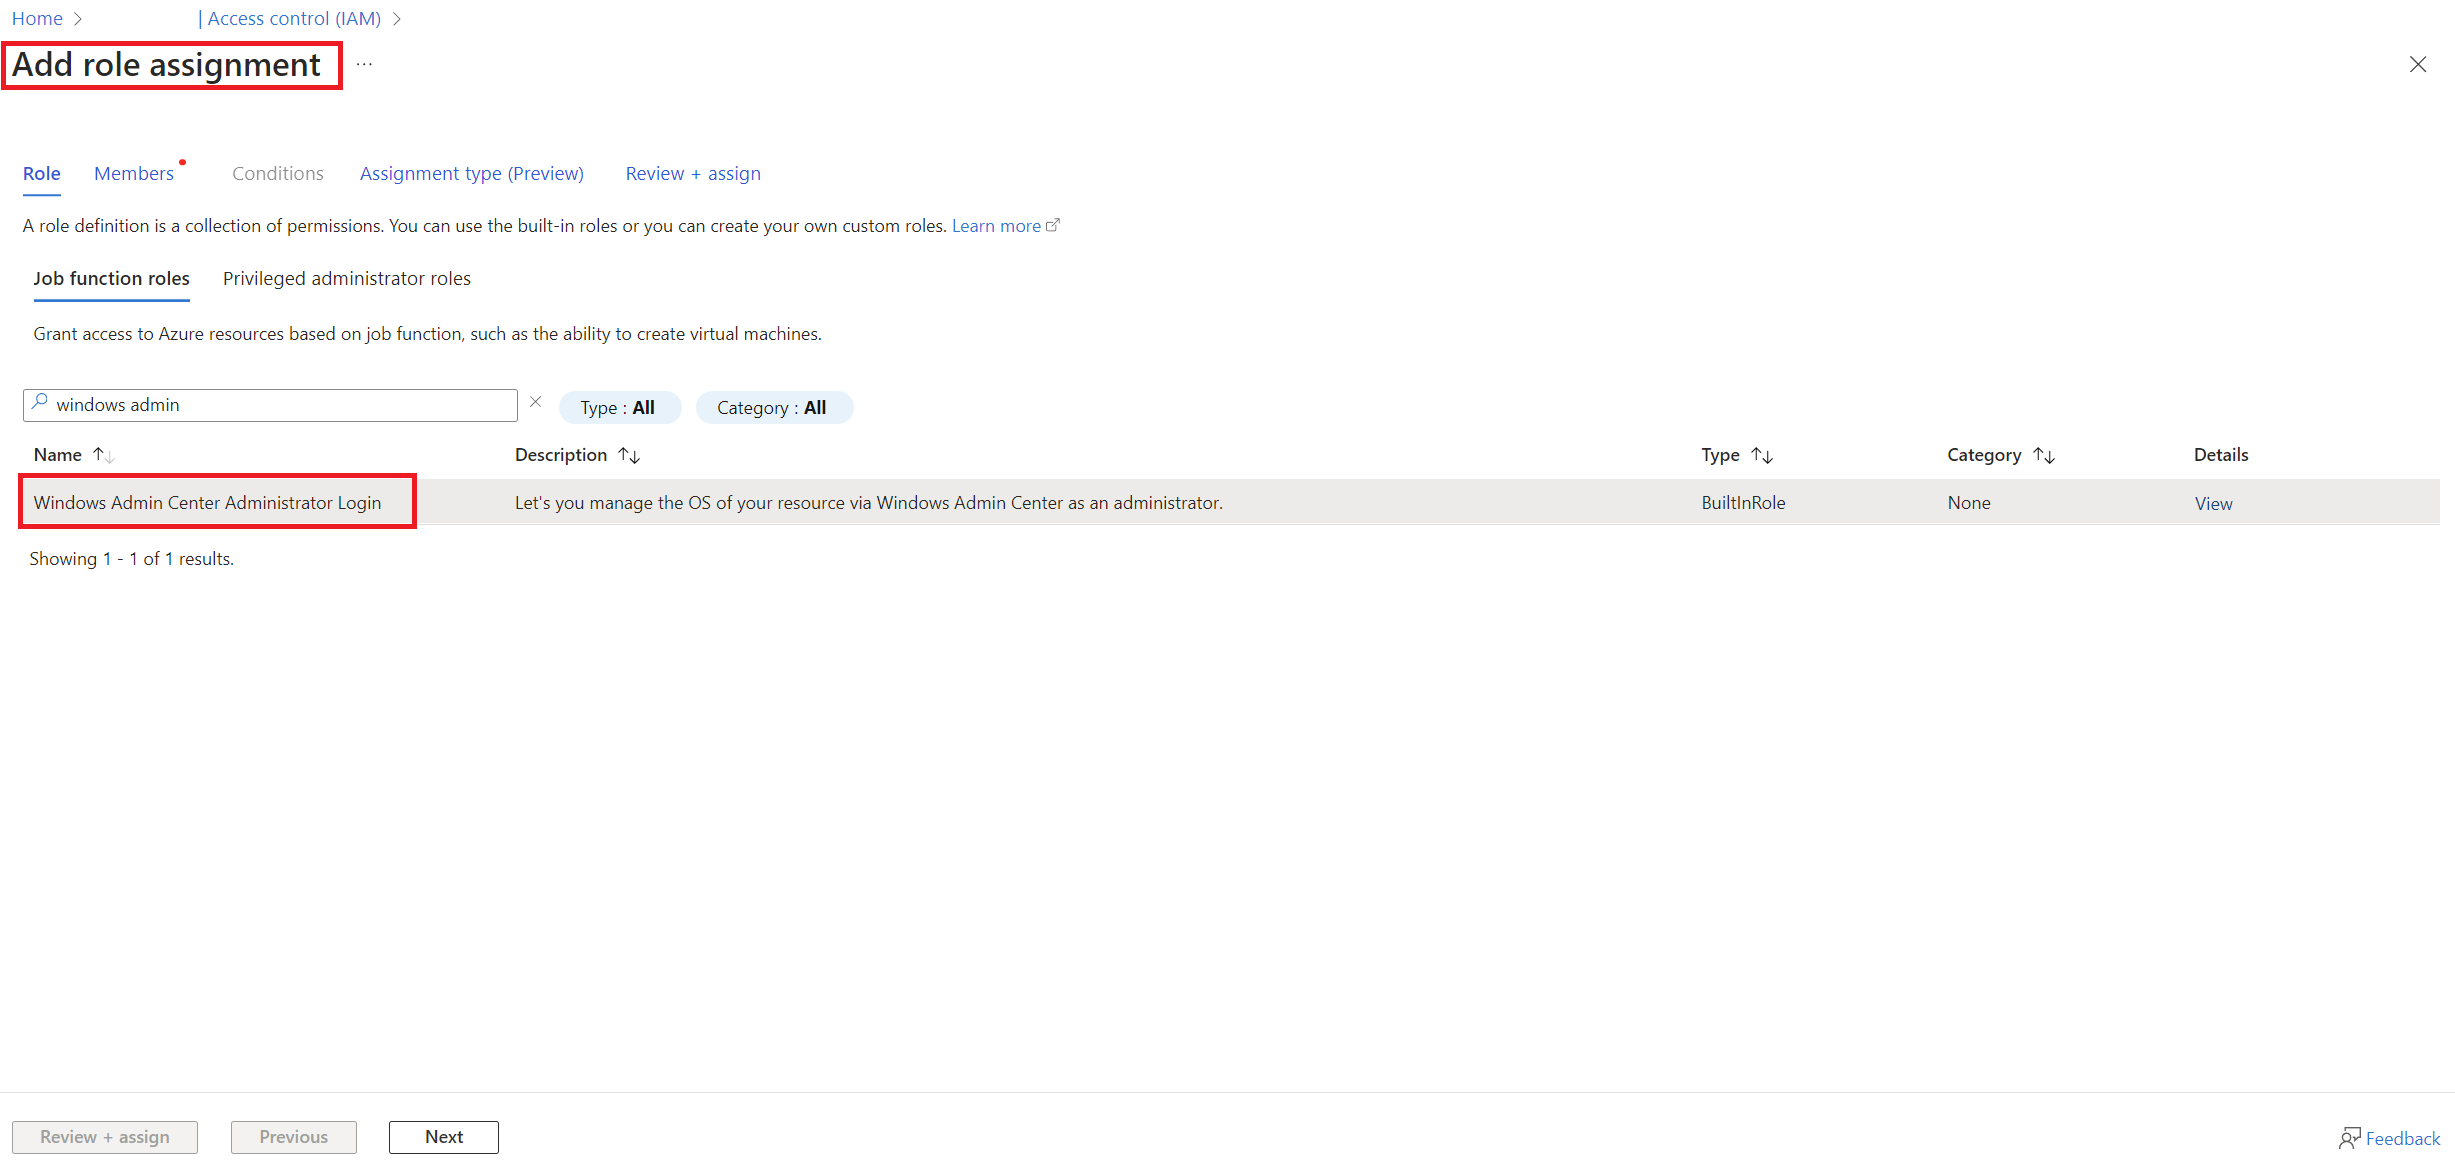
After this process and provided that everything has gone as expected, you will be able to manage the WAC of the cluster through your EntraID user.
I was unable to install the WAC extension (0.37.0.0) during this week because I received the following error: (That was related to the previous Azure Local version 2408)RetrieveCertificate: Failed to retrieve certificate from key vault using app service, even though I have the correct permissions and have successfully completed this process in the past.
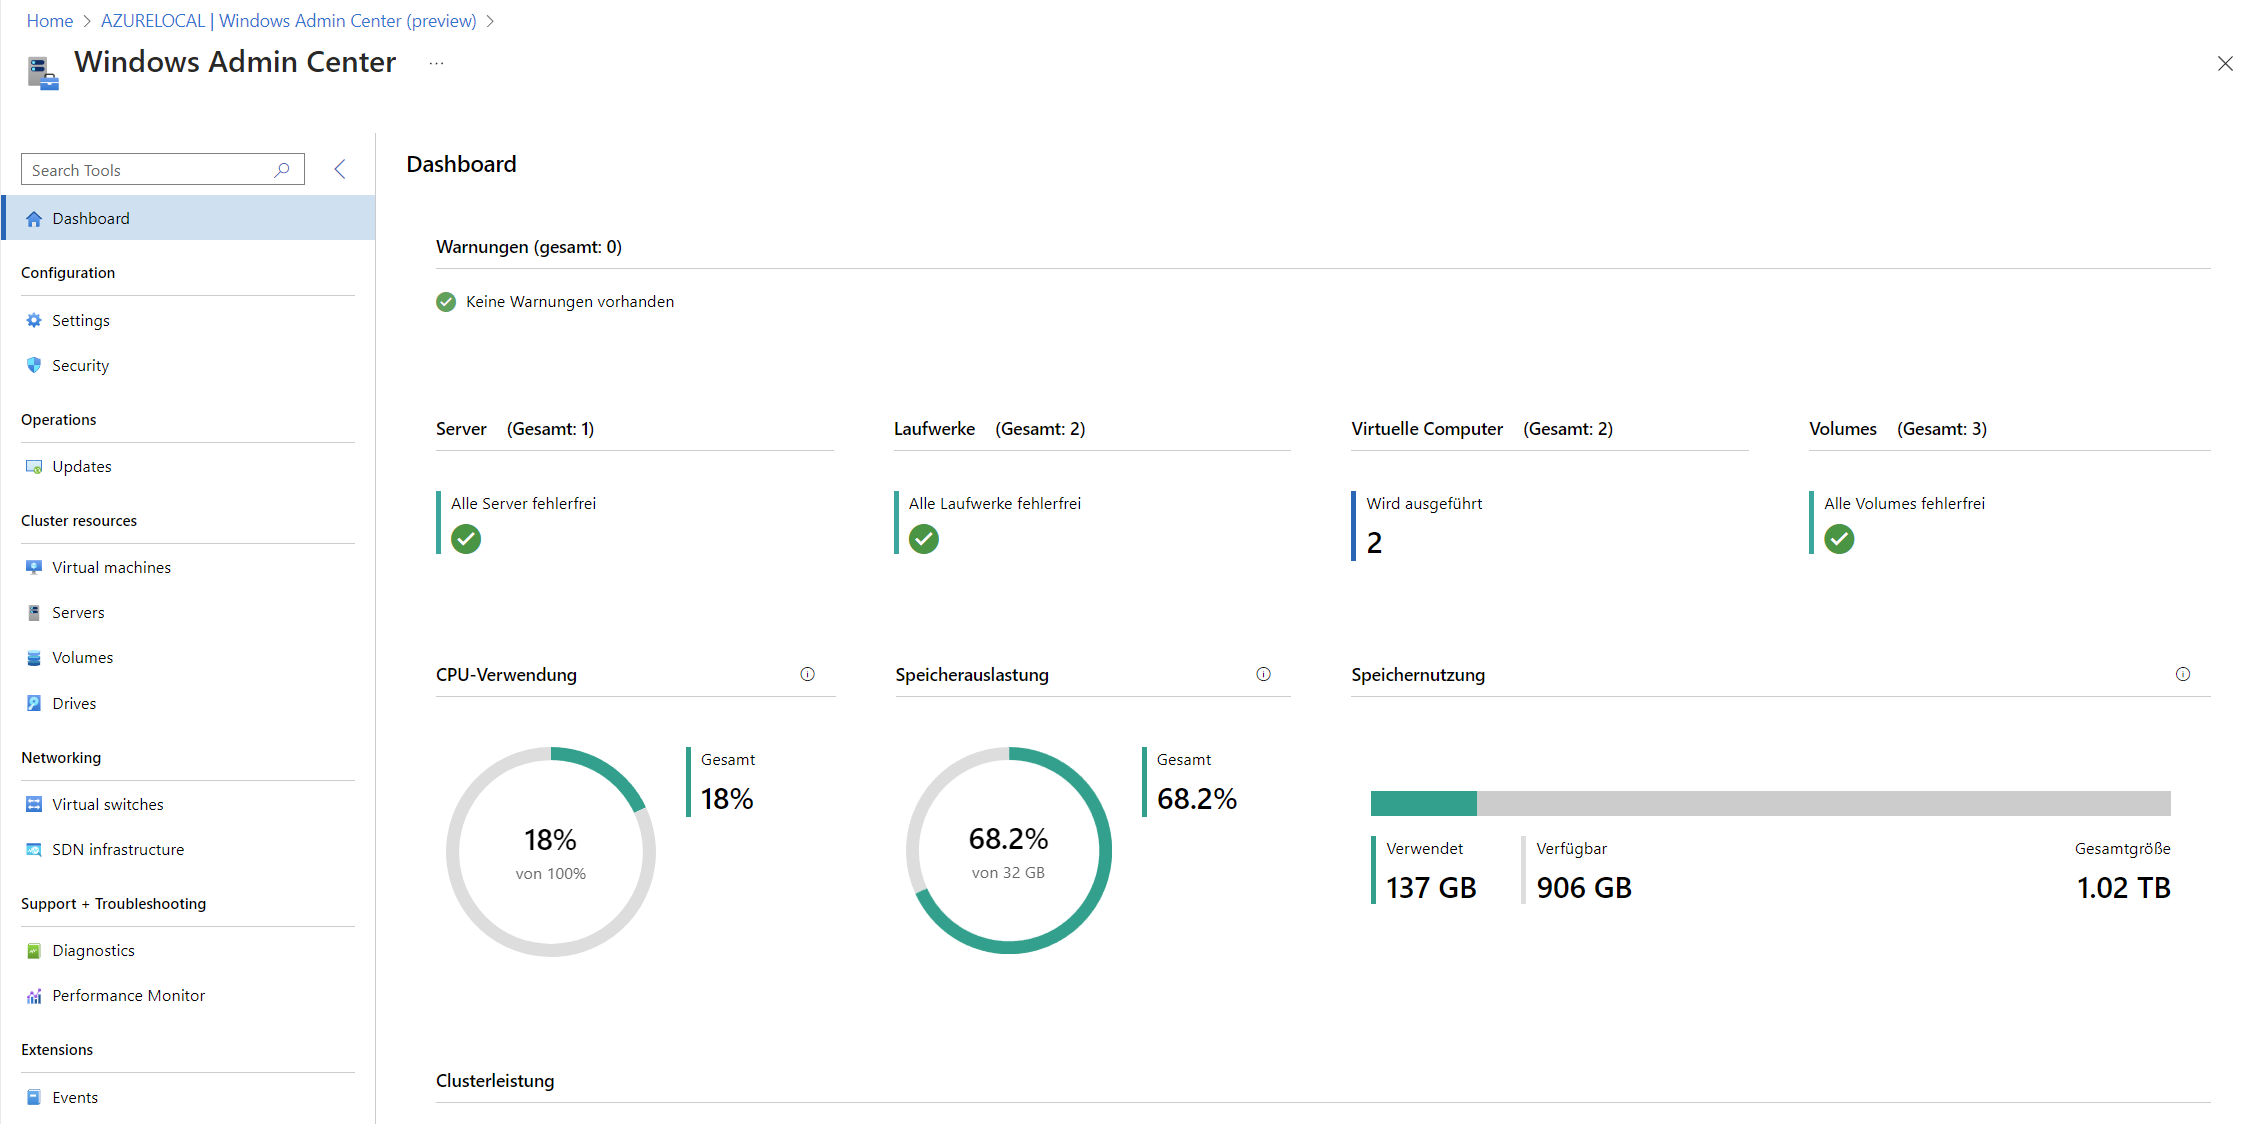
Update With the new version 10.2411.0.22 of AzureLocal (formerly known as Azure Stack HCI), it is now possible to use WAC again 🎉:
This means that WAC can be used once more to connect VMs remotely by accessing the host and pivoting to the VM through WAC.
Keep in mind that manual modifications (via Powershell or WAC) should be as minimal as possible, but there are still problems when managing certain VMs which are not present in Azure like ARC Resource Bridge itself, which is why it does not hurt to have an alternative to manage these resources from remote.
Monitoring and Alerting with Azure Monitor Insights
Monitoring your Azure Local cluster is a key part of keeping everything running smoothly. Azure Monitor Insights is a feature that helps you do just that by giving you visibility into the health, performance, and usage of your cluster, all within the Azure portal. While it’s a powerful tool, keep in mind that Insights isn’t real-time. It can take up to 15 minutes to collect data, so there may be a delay between what’s happening on your system and when it shows up in the portal.
Why Use Insights?
Insights offers several important benefits that make managing your HCI cluster easier:
- Managed by Azure: No need to worry about setting up databases or custom software, everything is handled in the Azure portal, so it’s always up to date.
- Scalability: Whether you’re monitoring one cluster or hundreds, Insights scales easily across different clusters and locations.
- Customization: You can tailor the monitoring views to suit your needs by changing thresholds, tweaking charts, or even adding new metrics to keep an eye on. All these changes can be saved and pinned to your Azure dashboard for quick access.
How to Enable Insights
Enabling Insights is straightforward:
- Go to your Azure Local cluster page in the Azure portal.
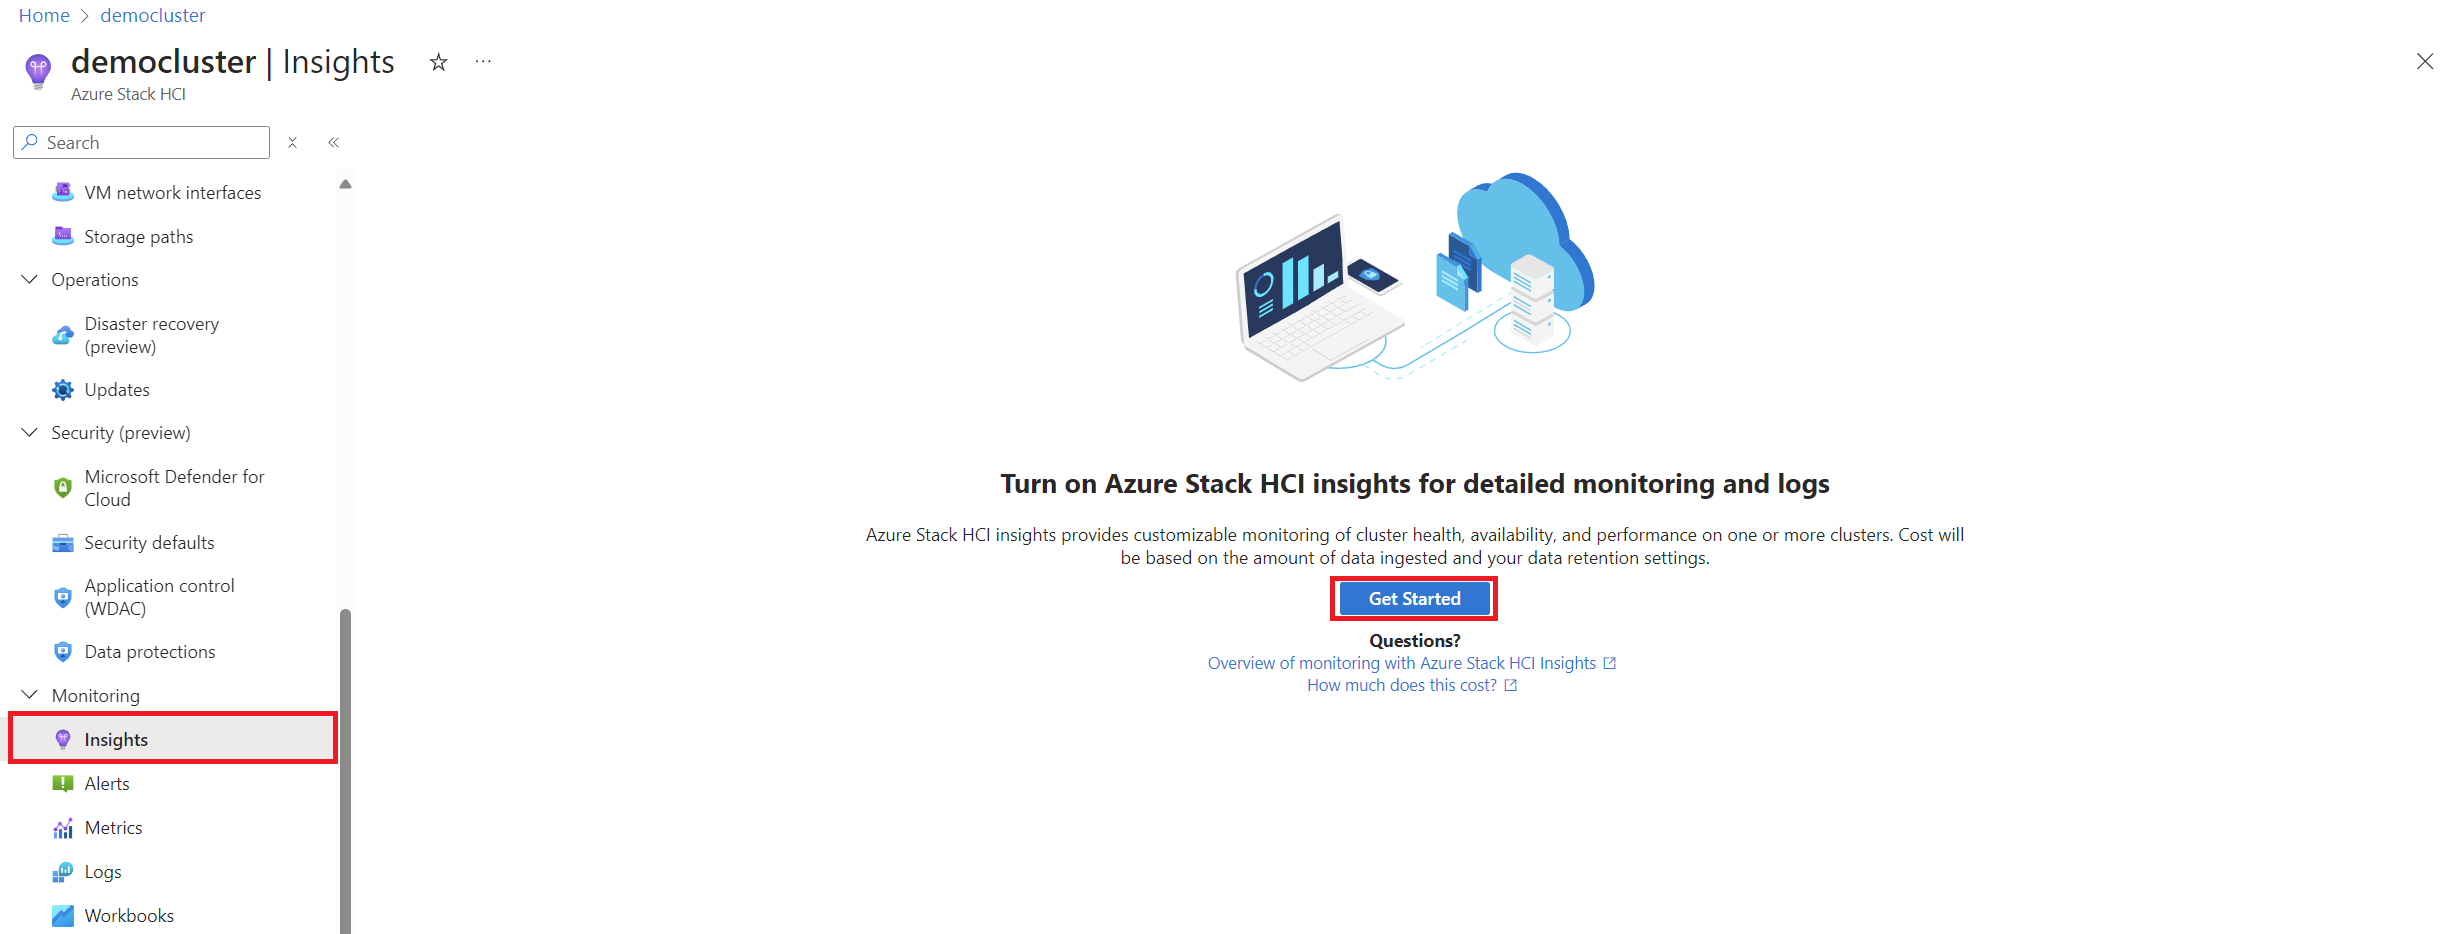
- Under the Monitoring tab, click on Insights and hit Get Started.
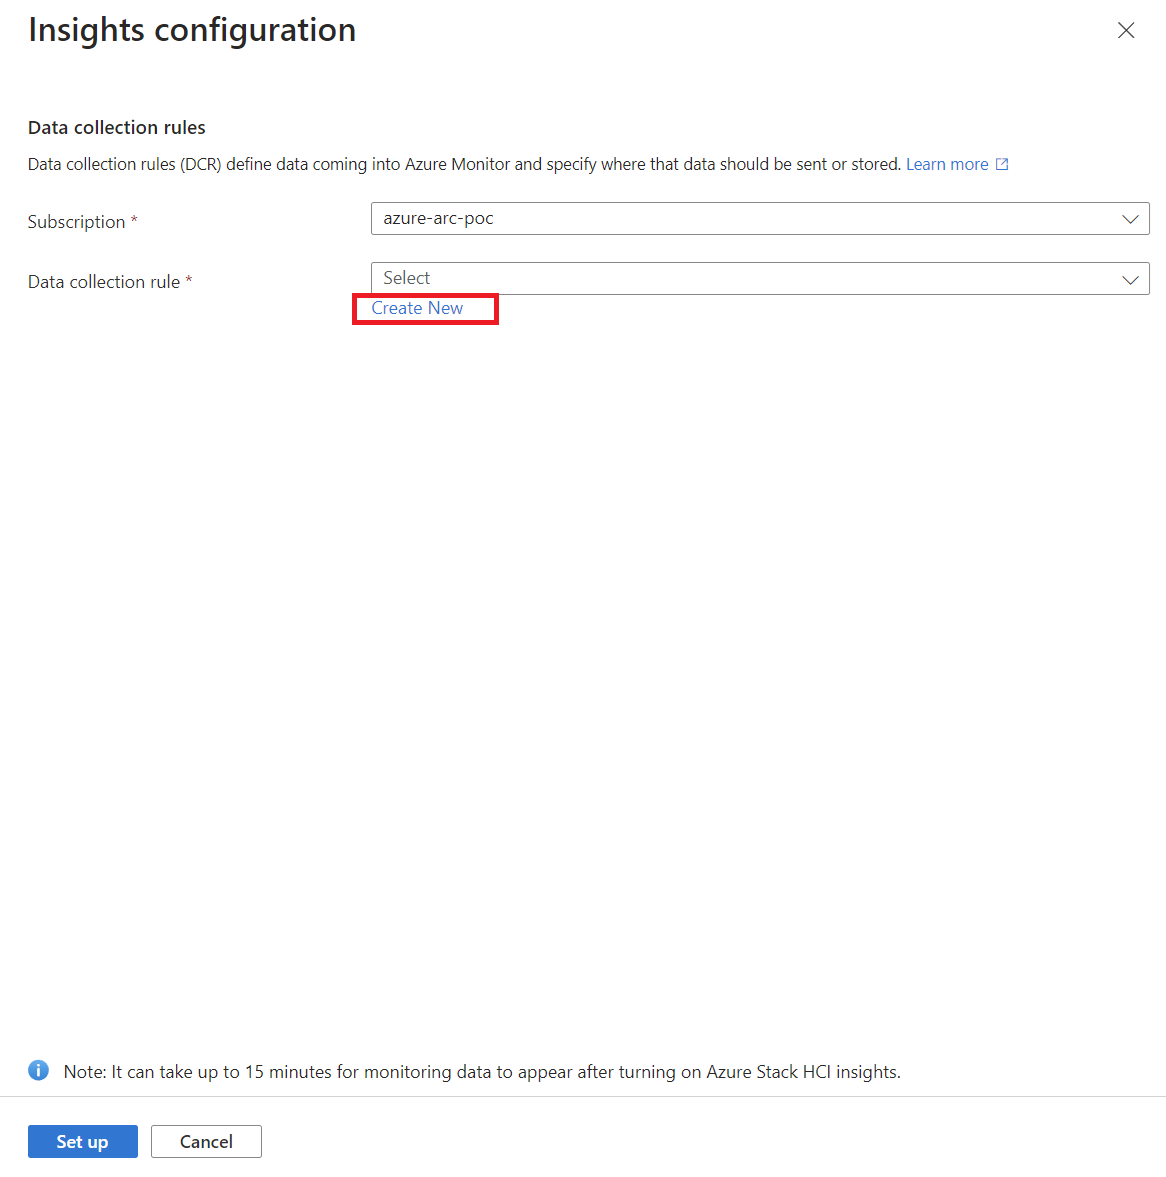
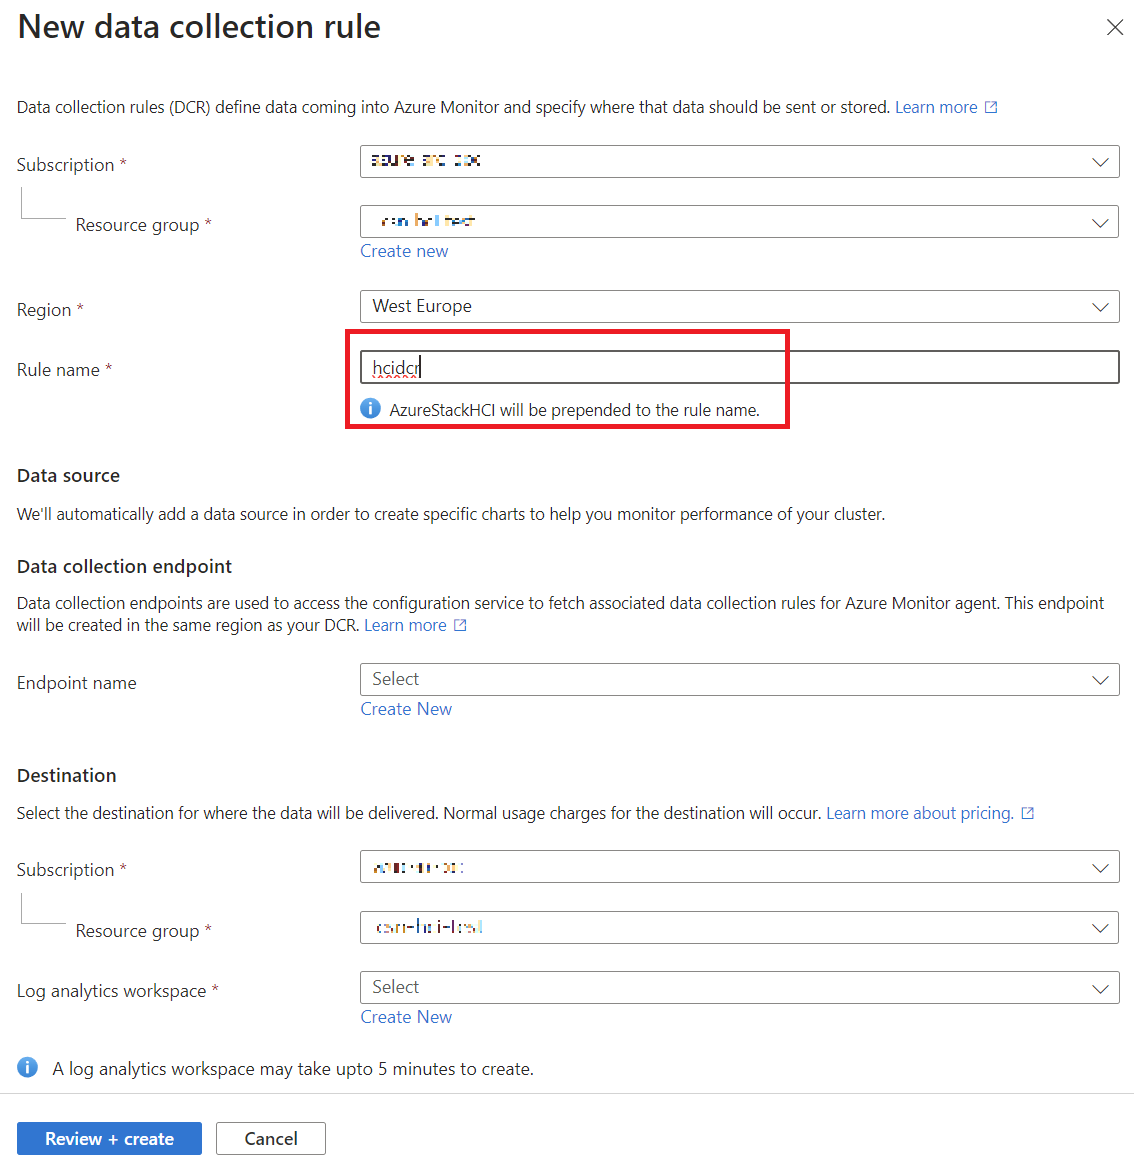
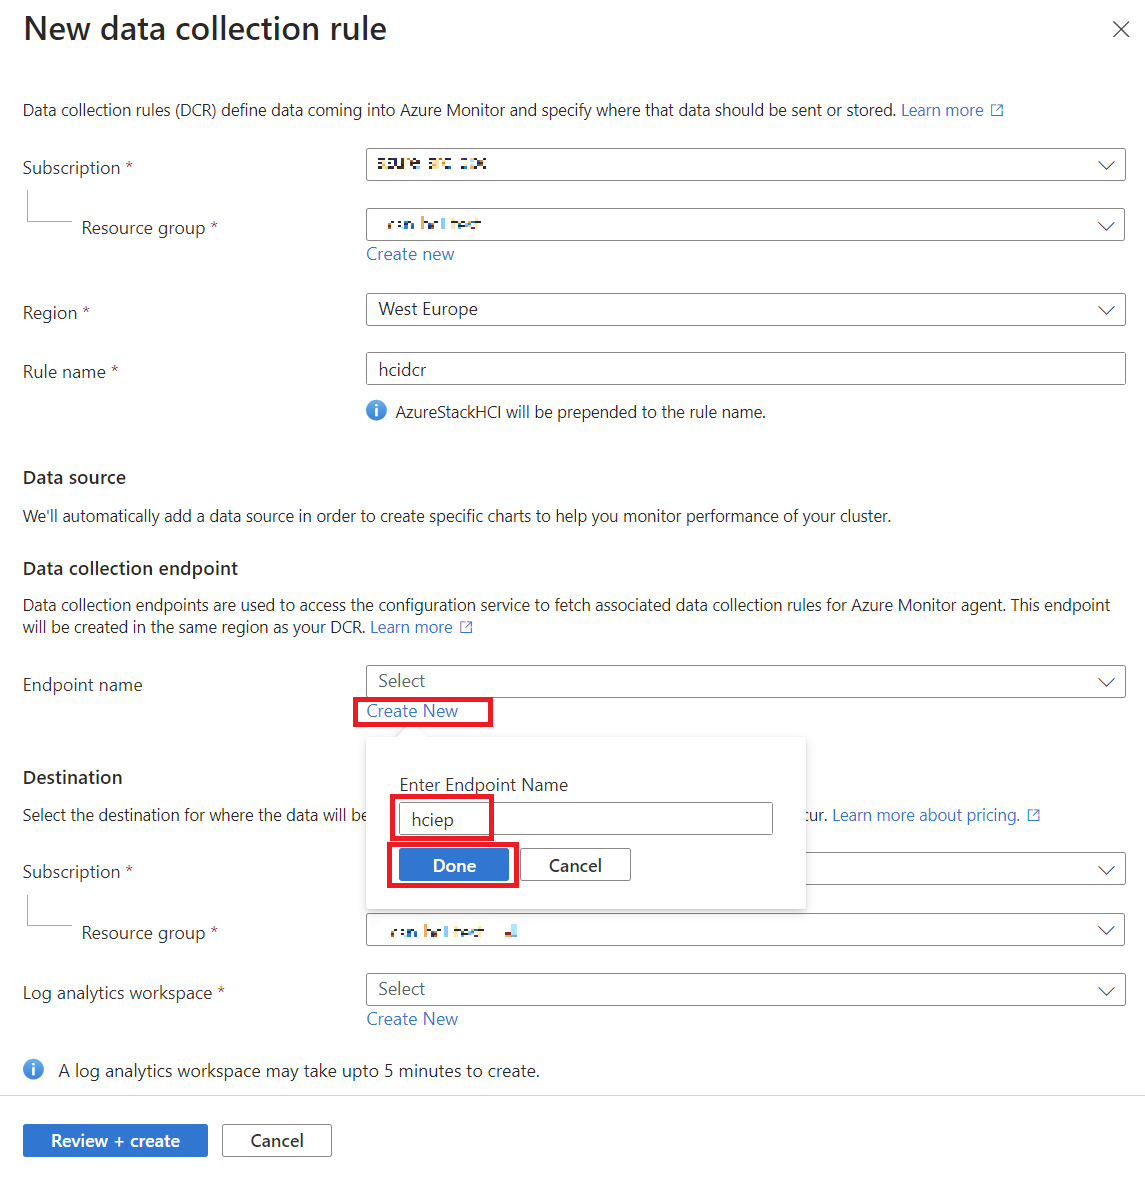
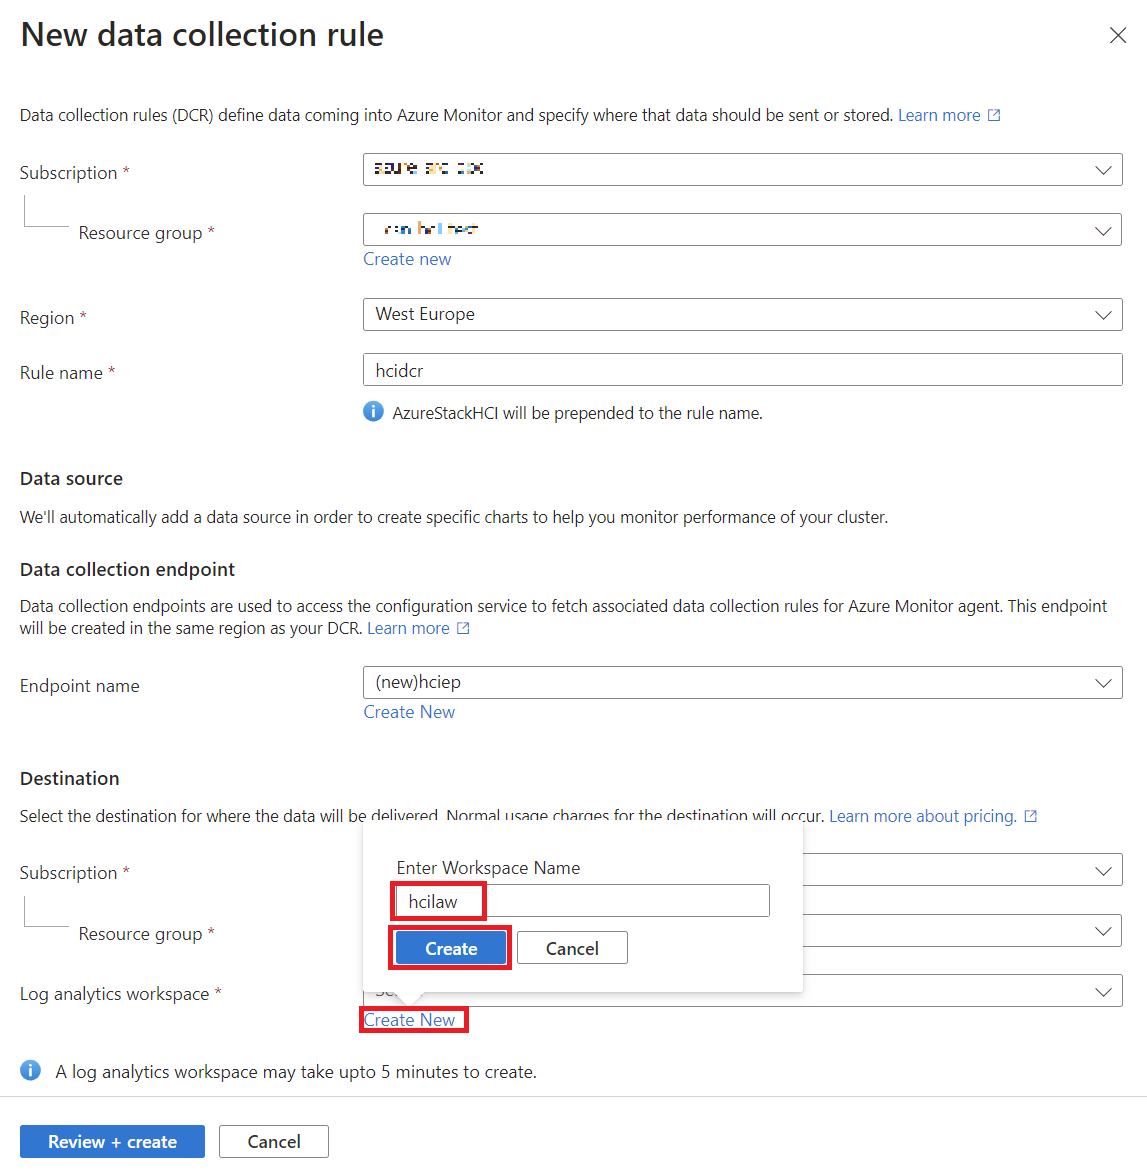
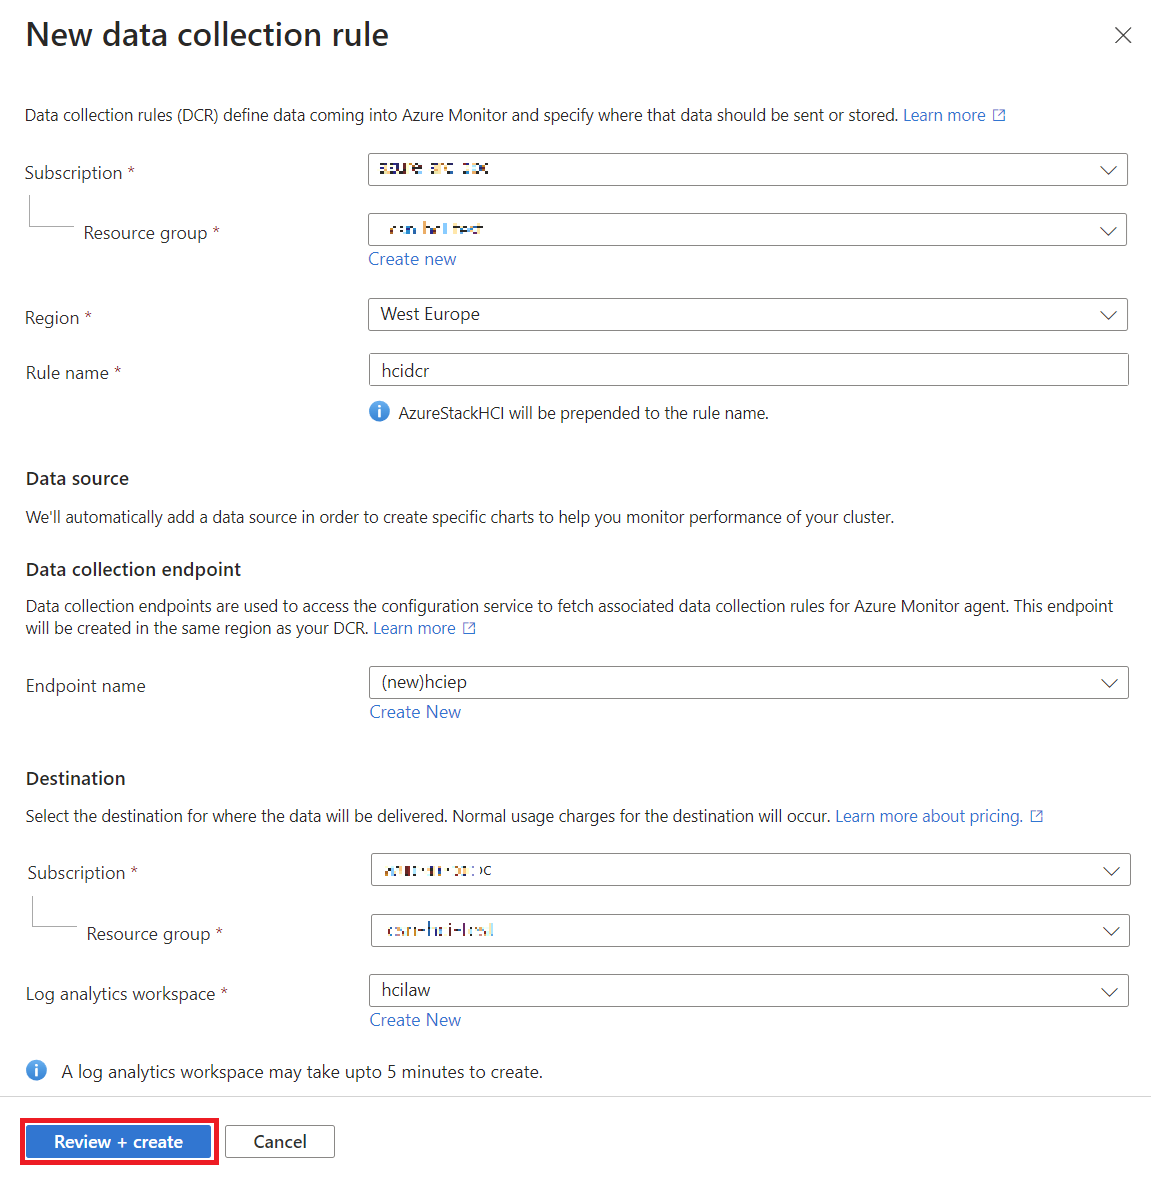
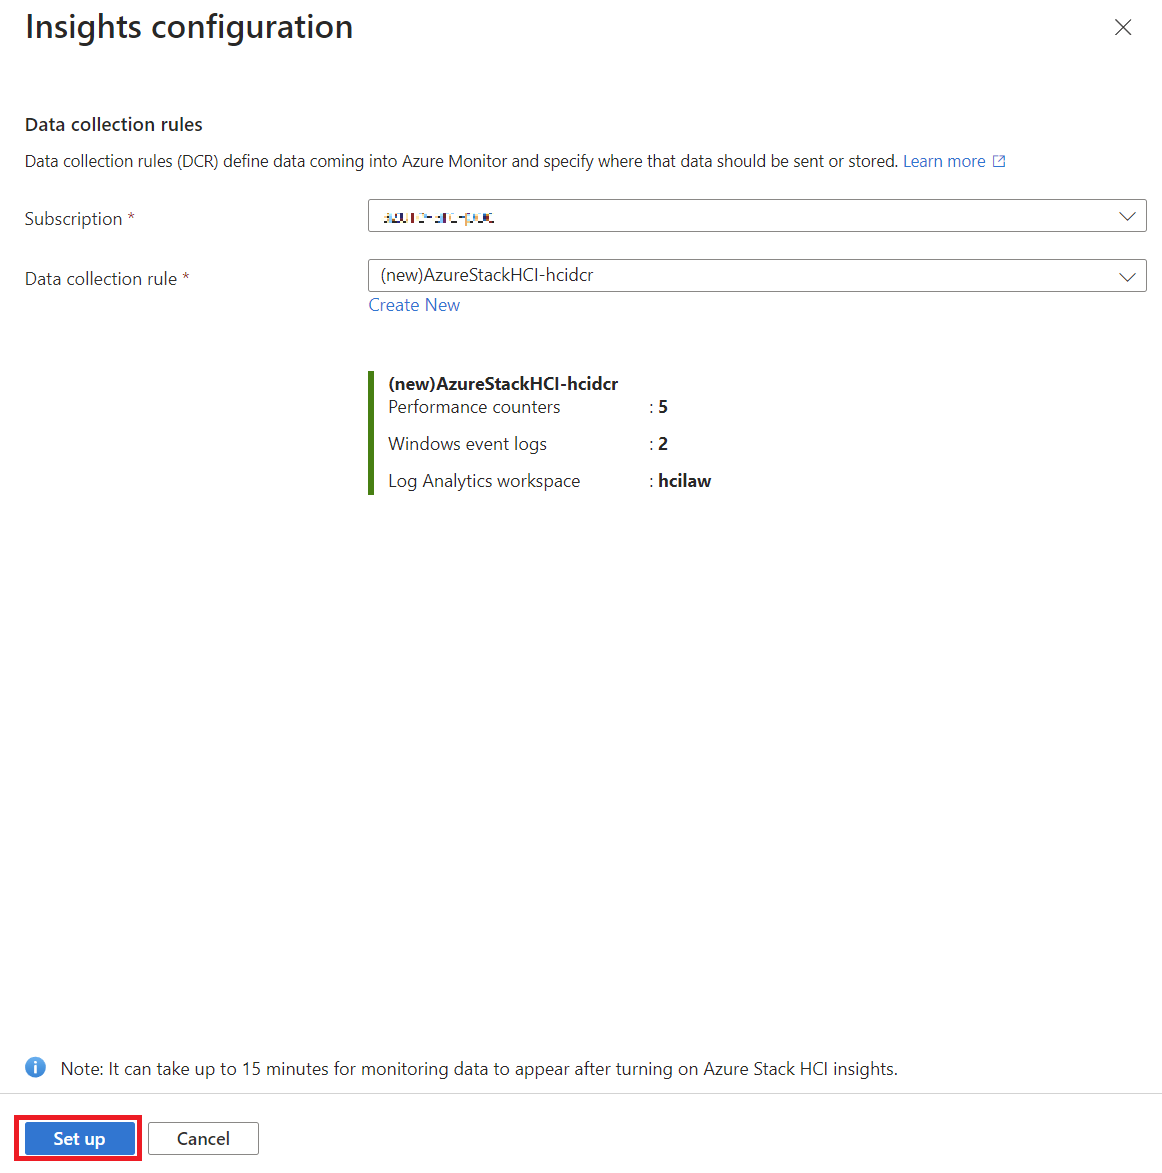
- You’ll need to set up a Data Collection Rule (DCR), which defines what data gets collected. You can use the default DCR, which is usually enough, or create your own if you want to collect extra data like Windows Event Logs.
Here is a step by step guide on how I have configured insight in the cluster:
Once you set it up, Insights will begin collecting information about your cluster’s performance. You’ll start seeing data like CPU usage, memory availability, and network activity, but remember it can take up to 15 minutes before data appears.
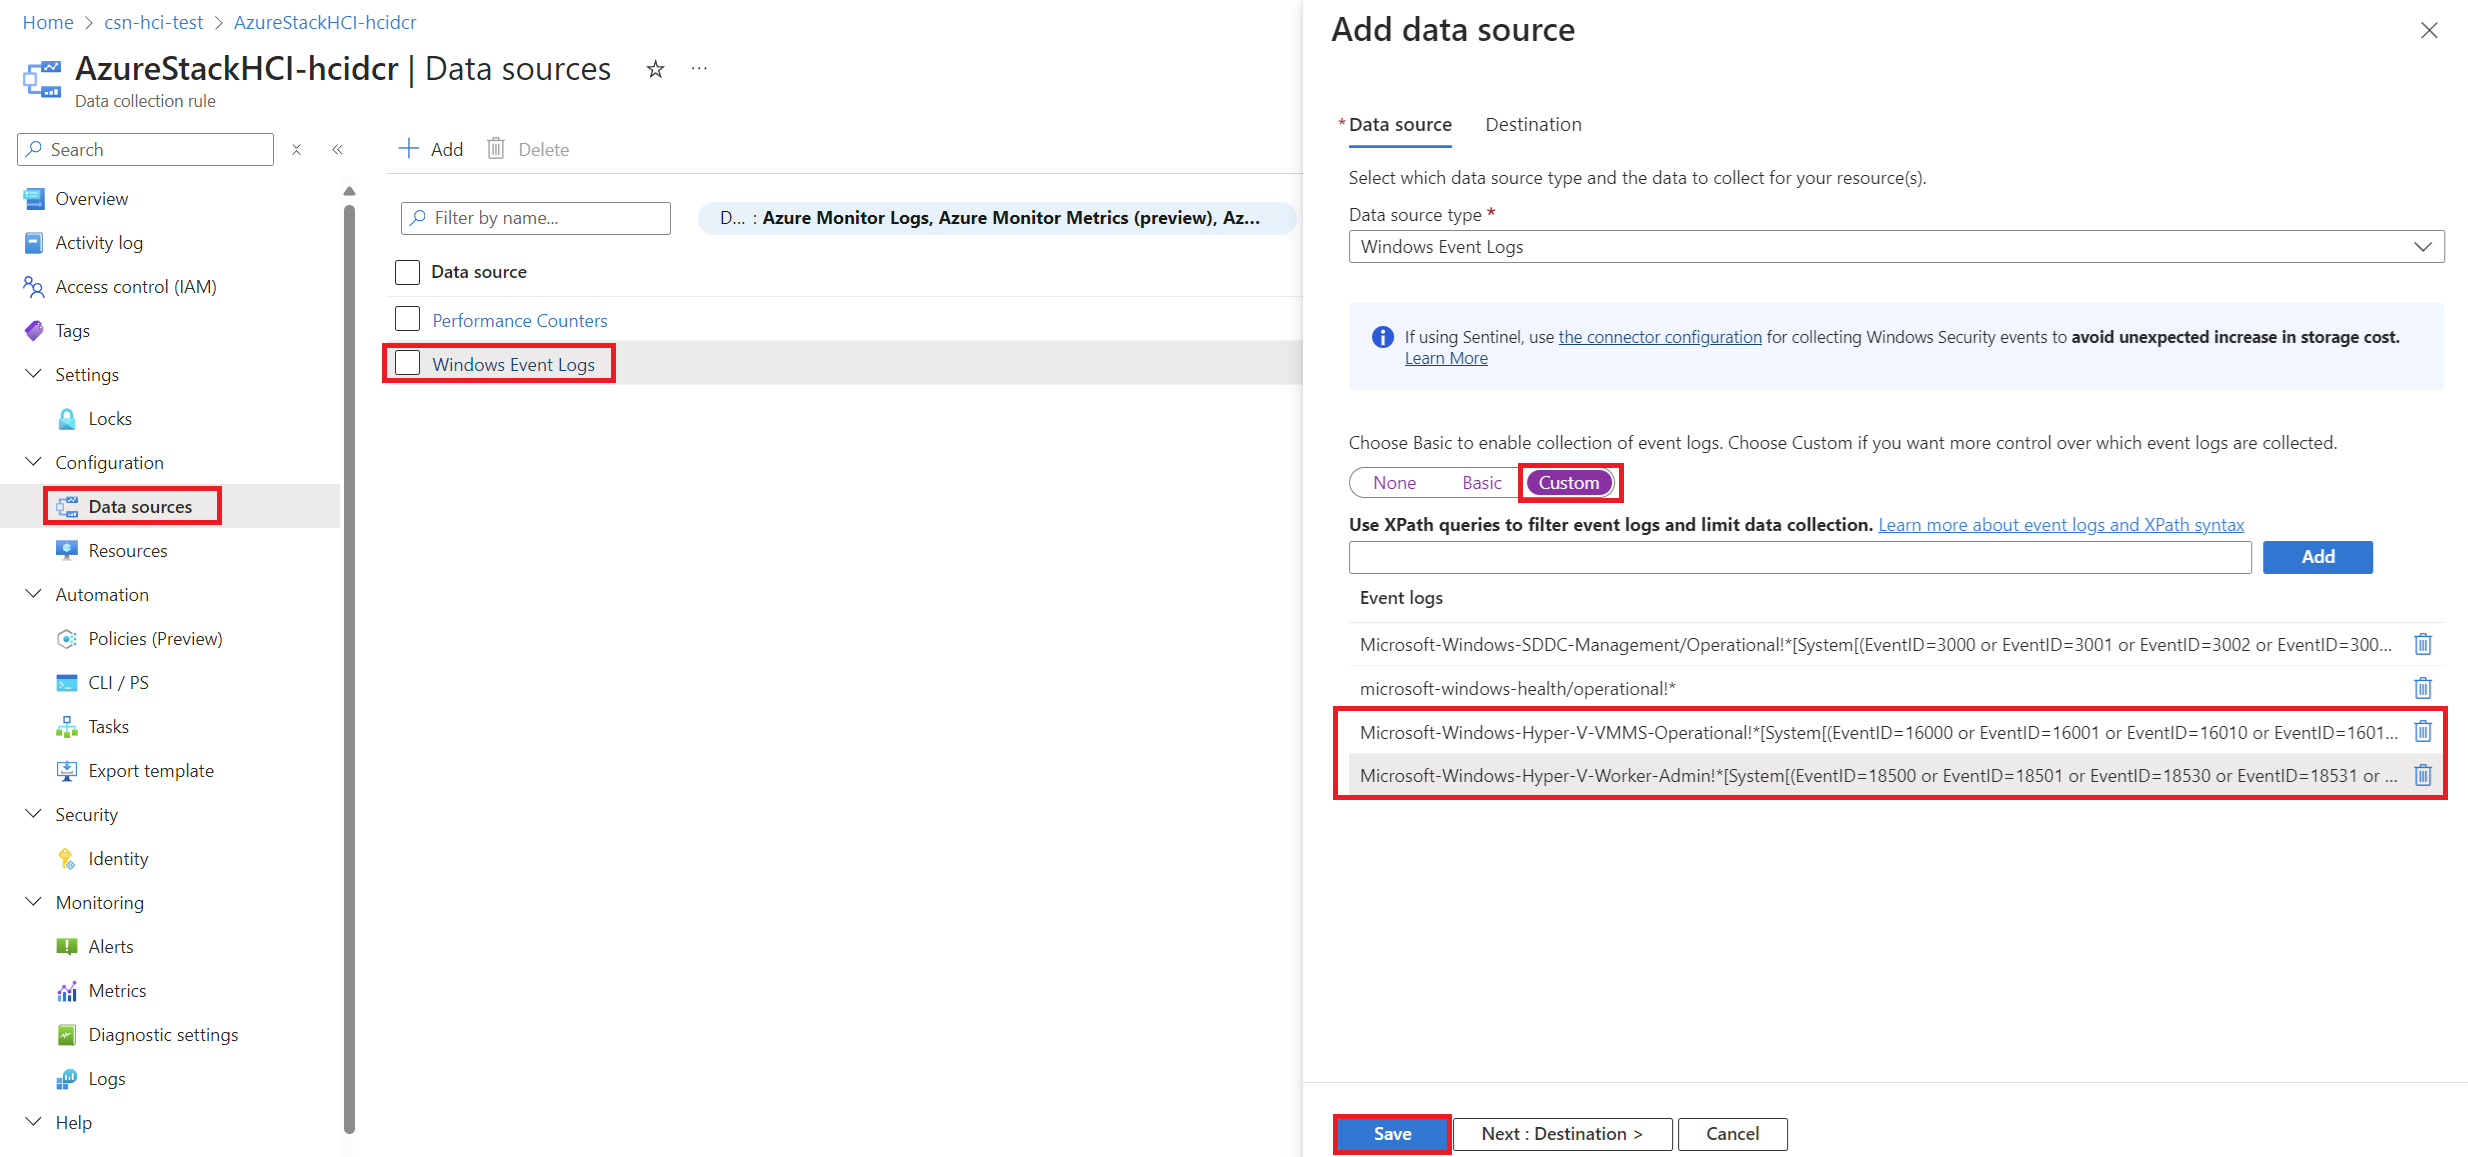
Since I’m experimenting with the possibility of creating a Workbook that includes more information about the VMs, I have added the following XPaths to the Datacollection Rule created:
Microsoft-Windows-Hyper-V-VMMS-Operational!*[System[(EventID=16000 or EventID=16001 or EventID=16010 or EventID=16011 or EventID=16020 or EventID=16021)]]- These Event IDs correspond to VM lifecycle events such as creation, deletion, starting, stopping, and state changes. Collecting these events will provide insights into the current VMs and their statuses.
Microsoft-Windows-Hyper-V-Worker-Admin!*[System[(EventID=18500 or EventID=18501 or EventID=18530 or EventID=18531 or EventID=18560 or EventID=18561)]]
In the Workbook I will also add the current status of the extensions, because it does not seem to update automatically and it is not listed as “outdated” either:

What Does It Monitor?
Insights tracks several key metrics to give you a comprehensive view of how your cluster is doing:
- Memory Availability: Shows how much memory is available for processes.
- Network Traffic: Monitors how much data is being sent and received across your network adapters.
- CPU Usage: Tells you how much processor time is being used by your virtual machines and other services.
- RDMA (Remote Direct Memory Access): Tracks data being sent and received over RDMA, which is important for optimizing network performance in HCI.
Insights also collects data from important Windows Event Logs, which helps identify issues with hardware, VMs, or storage components in your cluster.
For more information, you can check the official documentation on Monitoring Azure Local.
Setting Up Alerts
Azure Local allows you to set up alerts that notify you when something goes wrong, such as high CPU usage or low memory. These alerts can be configured to trigger based on specific conditions, so you’re always aware of critical issues. One of the easiest ways to get started with alerts is by enabling recommended alert rules, which are predefined based on common metrics and thresholds.
Enabling Recommended Alerts
Recommended alerts are preconfigured to monitor important metrics like CPU usage, available memory, and network traffic. These alerts are based on Azure’s knowledge of important thresholds and common customer use cases. If you haven’t set up any alert rules yet, Azure will provide a list of recommended alerts to get you started.
To enable these recommended alerts, follow these steps:
- Go to your Azure Local cluster resource page in the Azure portal.
- From the Monitoring section on the left pane, select Alerts and then click View + set up.
- Review the list of recommended alerts. These will include default values for conditions, such as CPU usage above 80% or memory dropping below 1 GB.
- You can adjust the severity of each alert (e.g., from “Informational” to “Error”) and modify the thresholds if needed.
- In the Notify me by section, make sure email notifications are enabled and provide your email address.
- Choose whether to use an existing action group to handle alert responses, and toggle the alert rules on.
- Finally, click Save to apply these alert rules to your cluster.
By enabling these rules, you’ll be automatically notified when your cluster reaches critical performance levels.
Viewing and Managing Alerts
Once the alert rules are set up, you can view and manage them anytime from the Alerts section in your Azure Local resource page. Here, you can edit alert rules to fine-tune thresholds or change how notifications are handled. For example, if you find that an alert triggers too frequently, you can adjust the threshold value or severity level to better suit your needs.
Predefined Recommended Alerts for Azure Local
Here are some of the common recommended alert rules that you can enable for your Azure Local cluster:
| Alert Name | Performance Counter | Unit | Suggested Threshold |
|---|---|---|---|
| Percentage CPU | Hyper-V Hypervisor Logical Processor\% Total Run Time | Percentage | Greater than 80 |
| Available Memory Bytes | Memory\Available Bytes | GB | Less than 1 GB |
| Volume Latency Read | Cluster CSVFS\Avg. sec/Read | Milliseconds | Greater than 500 ms |
| Volume Latency Write | Cluster CSVFS\Avg. sec/Write | Milliseconds | Greater than 500 ms |
| Network In Per Second | Network Adapter\Bytes Received/sec | GigaBytesPerSecond | Greater than 500 GB/sec |
| Network Out Per Second | Network Adapter\Bytes Sent/sec | GigaBytesPerSecond | Greater than 200 GB/sec |
These alerts provide a good starting point for monitoring the health of your cluster, but you can always customize them based on your specific needs.
For more details on setting up alerts, check out the official guide on Azure Local Recommended alert rules.
Windows Defender Application Control (WDAC)
Windows Defender Application Control (WDAC) helps secure your Azure Local environment by controlling which apps and drivers can run. It’s a great tool to reduce security risks, but sometimes managing installations can be tricky, especially when dealing with unsigned or new applications. For example, installing the Disaster Recovery agent (currently in preview) can fail due to signature issues, which we’ll address in future articles (Backup and Disaster Recovery).
WDAC Modes: Audit vs. Enforced
You can run WDAC in two modes:
- Audit Mode: Useful for testing. It lets you see what would be blocked without actually preventing apps from running.
- Enforced Mode: This is the default mode, where WDAC actively blocks anything not allowed.
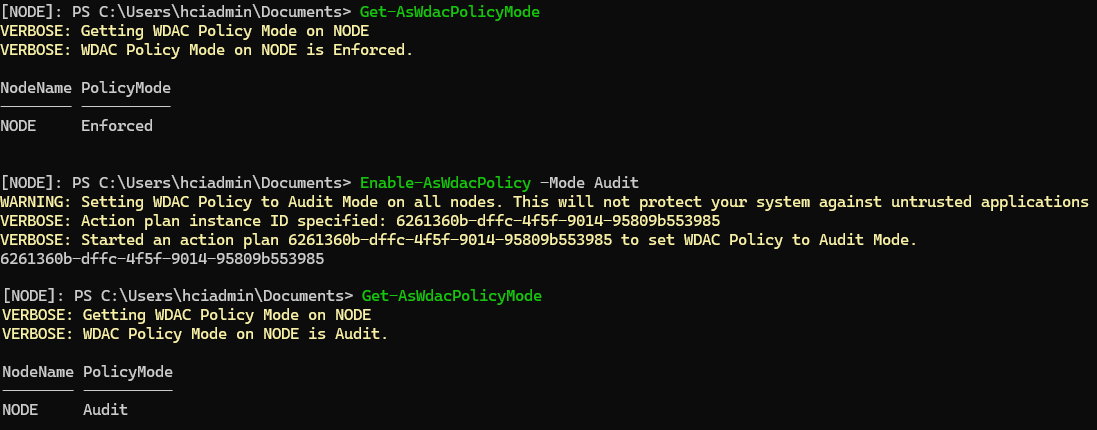
Switching between modes can be done via PowerShell at cluster level. Here’s how to check and switch modes:
Get-AsWdacPolicyMode
Enable-AsWdacPolicy -Mode Audit
Enable-AsWdacPolicy -Mode Enforced
In my test environment, I switched WDAC to Audit Mode to allow future testing, as shown in the image below:
For production environments, always ensure Enforced Mode is enabled for maximum security and in case you need to install any application on the nodes (for example Veeam) make sure that the provider offers you the necessary policies for WDAC.
More information can be found at the following link: Azure Local 23H2 Manage WDAC
BitLocker in Azure Local
BitLocker provides disk-level encryption to secure data at rest on your Azure Local clusters. It can encrypt both OS volumes and data volumes, offering an important layer of security for production environments handling sensitive information.
In Azure Local version 23H2, you can manage BitLocker either via the Azure portal (to view settings) or through PowerShell (to enable or disable encryption). For example, you can check the current encryption status using the following PowerShell command:
Get-ASBitLocker
To enable encryption, you can run:
Enable-ASBitLocker -VolumeType <BootVolume | ClusterSharedVolume>
Keep in mind that enabling BitLocker on ClusterSharedVolumes (CSV) is disruptive, as it pauses VMs temporarily, so plan accordingly.
In our Demolab, I’ve disabled BitLocker to save space on the host (my laptop). This makes sense for testing environments, but in production, it’s recommended to keep BitLocker enabled for added security.
For a more detailed guide on BitLocker, including advanced scenarios like recovery keys and encryption settings, I recommend checking out Jaromir’s excellent Bitlocker deep dive.
Creating VM Images for Azure Local
In Azure Local, creating and managing VM images is crucial for deploying virtual machines. One of the simplest ways I handle this is by downloading images directly from the Azure Marketplace. However, these images come in VHD format (not VHDX, which is the default for Hyper-V environments), so it’s something to keep in mind.
There are three main methods I use to create VM images:
- From a Storage Account (I won’t go into this here, but it’s a great option for automating image management).
- From a Local Share (I’ll cover this in the future when I have my VHDX conversion script ready).
- From the Azure Marketplace (this is the process I’ll explain now).
Creating a VM Image from Azure Marketplace
Here’s how I create a VM image using Azure Marketplace images in the Azure portal:
- I navigate to my Azure Local cluster resource.
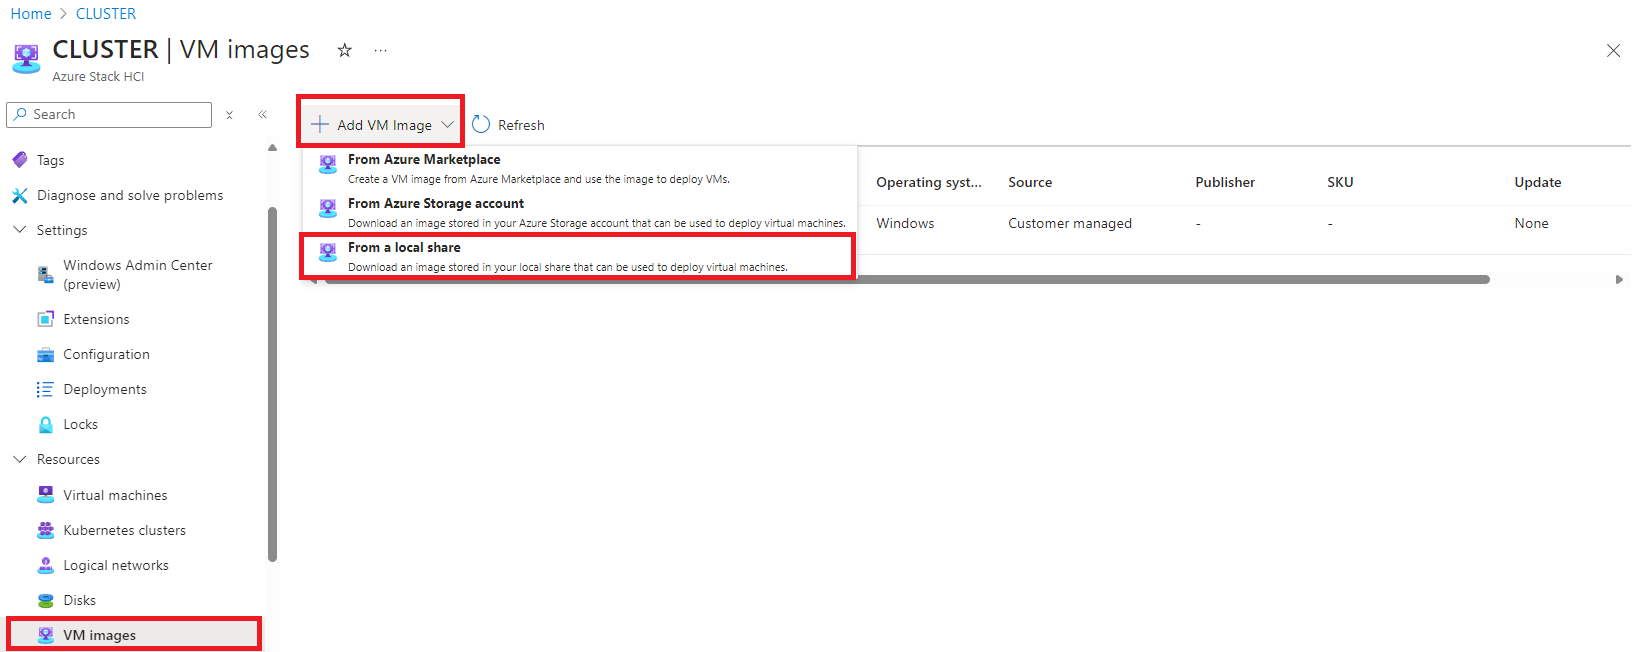
- Then I go to Resources > VM images and select + Add VM Image.
- On the Create an image page, I fill in the required information:
- Subscription and Resource Group.
- Custom Location: This matches the location of my Azure Local cluster.
- Image to download:I have chosen
Windows Server 2022 Datacenter: Azure Editionto show all checks in green, but later I will also downloadWindows 11 MultiSession + M365 Appsfor the Azure Virtual Desktops PoC. - Storage Path: I can either let Azure choose this automatically or manually specify a path with enough storage.
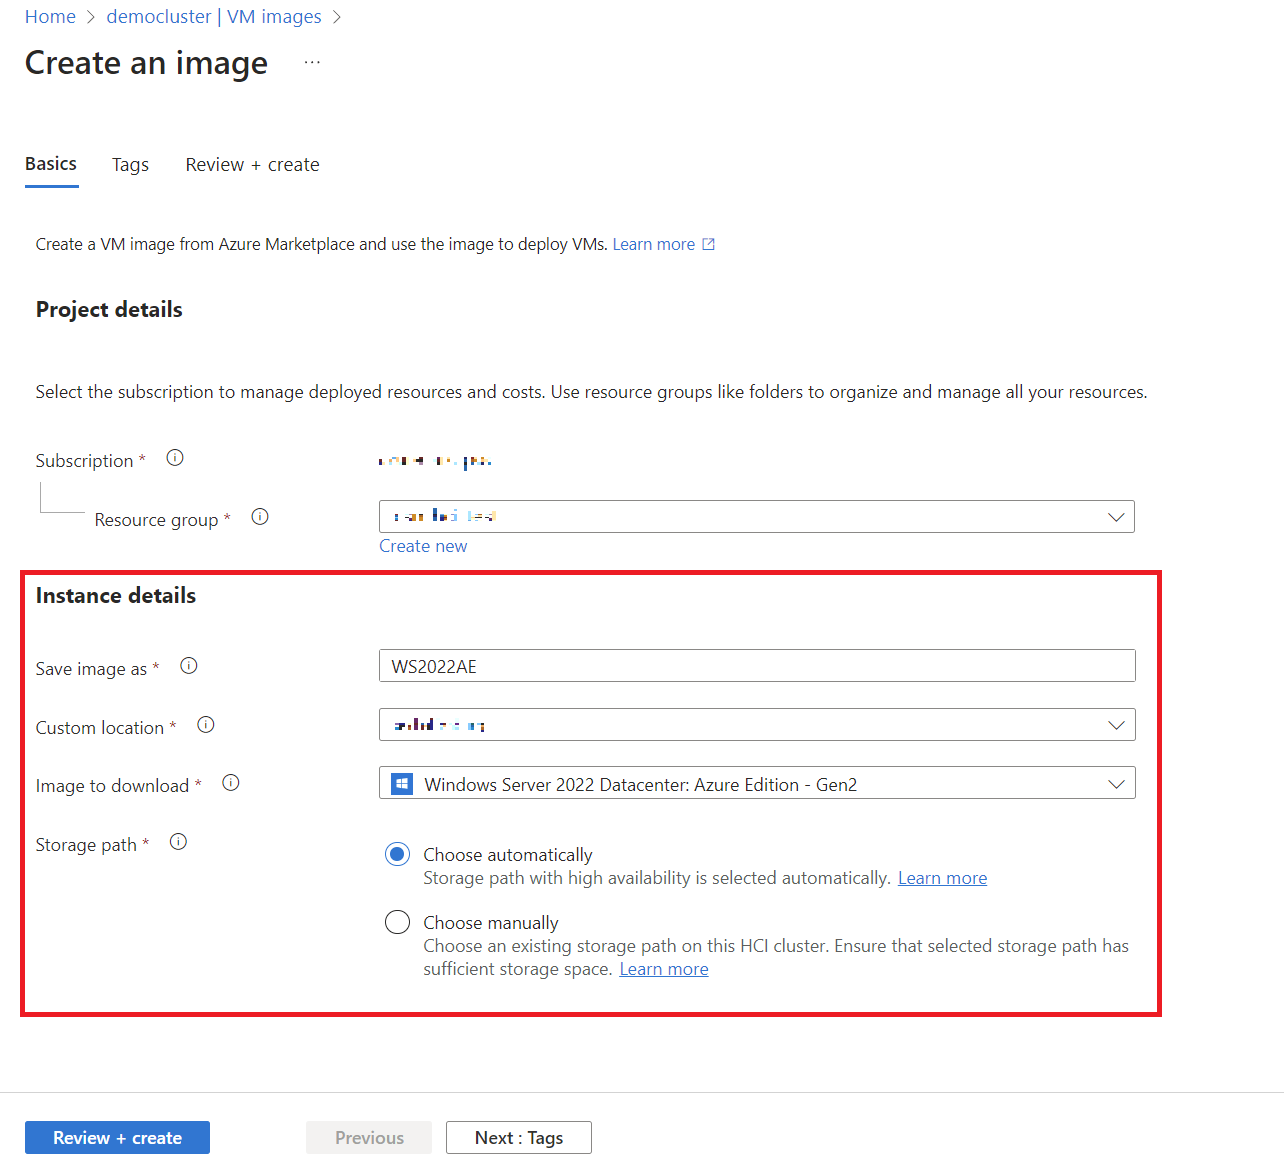
- After clicking Review + Create, the image creation starts. Depending on the image size and network speed, it may take some time.
- Once the image is downloaded, it shows up in the list as Available, and I can use it to deploy VMs.
For more details, you can always refer to the official guide.
Custom Images Script
In my ongoing efforts to streamline the process of creating custom VM images for Azure Local, I’ve developed a PowerShell script named 11_ImageBuilderAzSHCI.ps1. This script automates many steps, such as downloading images from Azure Marketplace, converting them to the VHDX format, and optimizing them on the VM Node.
However, I’ve intentionally omitted the part of the script that would automatically add the optimized VHDX image back into Azure Local via Azure CLI commands. The reason for this is that the Azure CLI currently does not support the inclusion of Hyper-V Generation 2 VM images directly into Azure Local. Attempting to automate this step would involve complex ARM or Bicep scripting, which can be quite tedious and time-consuming for this specific case.
Therefore, I’ve opted to perform this final step manually. After the script completes the download and conversion process, I manually add the optimized VHDX image into Azure Local using the Azure Portal. This approach simplifies the script and reduces potential errors that could arise from unsupported or complex automation steps.
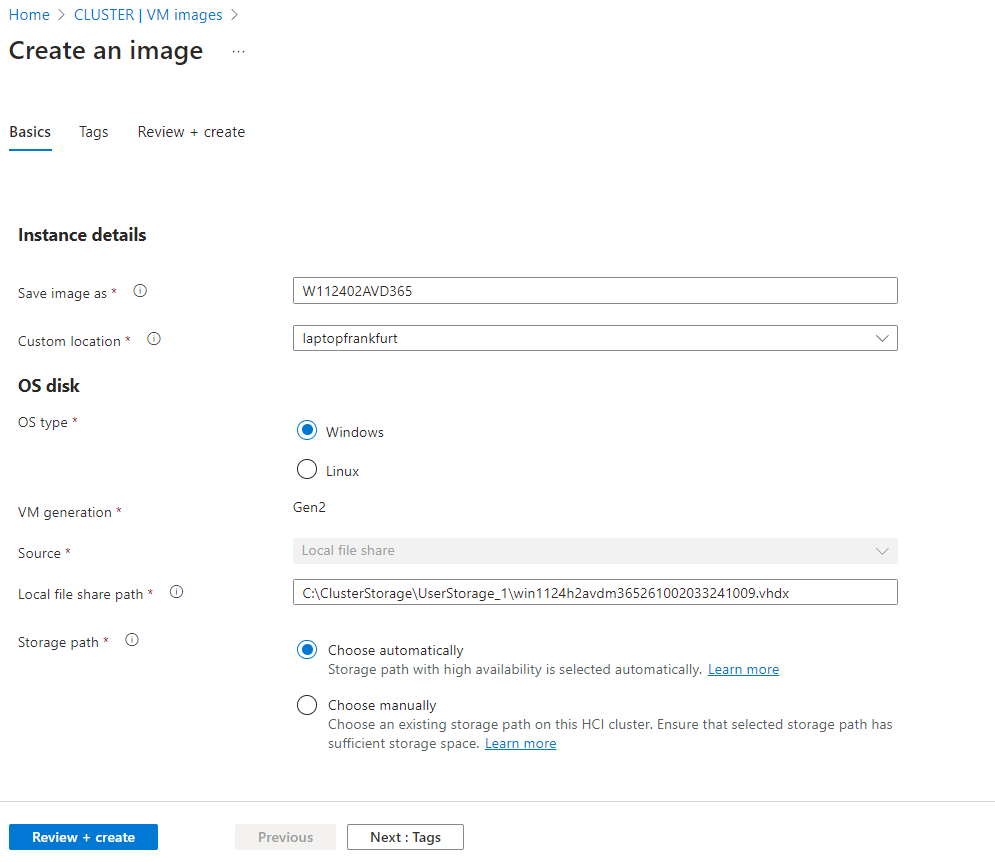
Here’s are screenshots illustrating the manual addition of the VHDX image:
I plan to revisit this automation in the future when the tools and support for Hyper-V Generation 2 images become more mature, potentially allowing for full automation without the need for complex scripting.
You can download the script from my GitHub repository here.
Bonus: Automating Cluster Start and Stop Operations
Managing the startup and shutdown sequences of your Azure Local cluster is essential, especially when you need to power down the host for maintenance or energy savings. To simplify this process, I’ve created a PowerShell script called 10_StartStopAzSHCI.ps1 that automates turning the cluster off and on.
Script: 10_StartStopAzSHCI.ps1
This script ensures that the Domain Controller (DC) and Cluster Node VMs are started and stopped in the correct order, preventing potential issues with services that depend on Active Directory or cluster resources.
Features:
- Stop Operation:
- Connects to the Cluster Node VM and stops the Cluster service.
- Shuts down the Cluster Node VM.
- Shuts down the Domain Controller VM.
- Start Operation:
- Starts the Domain Controller VM and waits for its services to become available.
- Starts the Cluster Node VM.
- Starts the Cluster service on the Cluster Node VM.
Usage Instructions:
- Prerequisites:
- Run the script with administrative privileges.
- Ensure the execution policy allows the script to run:
Set-ExecutionPolicy RemoteSigned -Scope CurrentUser - Update the script variables to match your environment, such as VM names and credentials.
- Running the Script:
- Open PowerShell with administrative privileges.
- Navigate to the directory where the script is saved.
- Execute the script:
.\10_StartStopAzSHCI.ps1 - When prompted, type
startorstopto initiate the desired operation.
By using this script, you can safely power down your Azure Local cluster when you need to shut down the host machine, and easily bring it back online when needed.
You can download the script from my GitHub repository here.
Conclusion
Now that we’ve walked through the essential Day 2 Operations for Azure Local, I hope you have a better understanding of how to configure, activate, and optimize the key features of your environment. From showing the operability from Azure Arc Resource Bridge and setting up logical networks to managing Windows Admin Center, monitoring, alerts, and even VM images, these are the building blocks that bring your Azure Local infrastructure to life.
As you’ve seen, many of the features require manual activation after the initial deployment, and it’s crucial to configure them correctly to ensure your environment is ready for production workloads. Whether you’re deploying AVD, AKS, or just managing virtual machines, each feature we’ve covered plays a significant role in making sure your system is secure, performant, and scalable.
In my demo lab, I’ve shown how to manage these configurations, but in a real production environment, you’ll want to tailor these steps to meet your specific needs, especially when it comes to security features like WDAC and BitLocker.
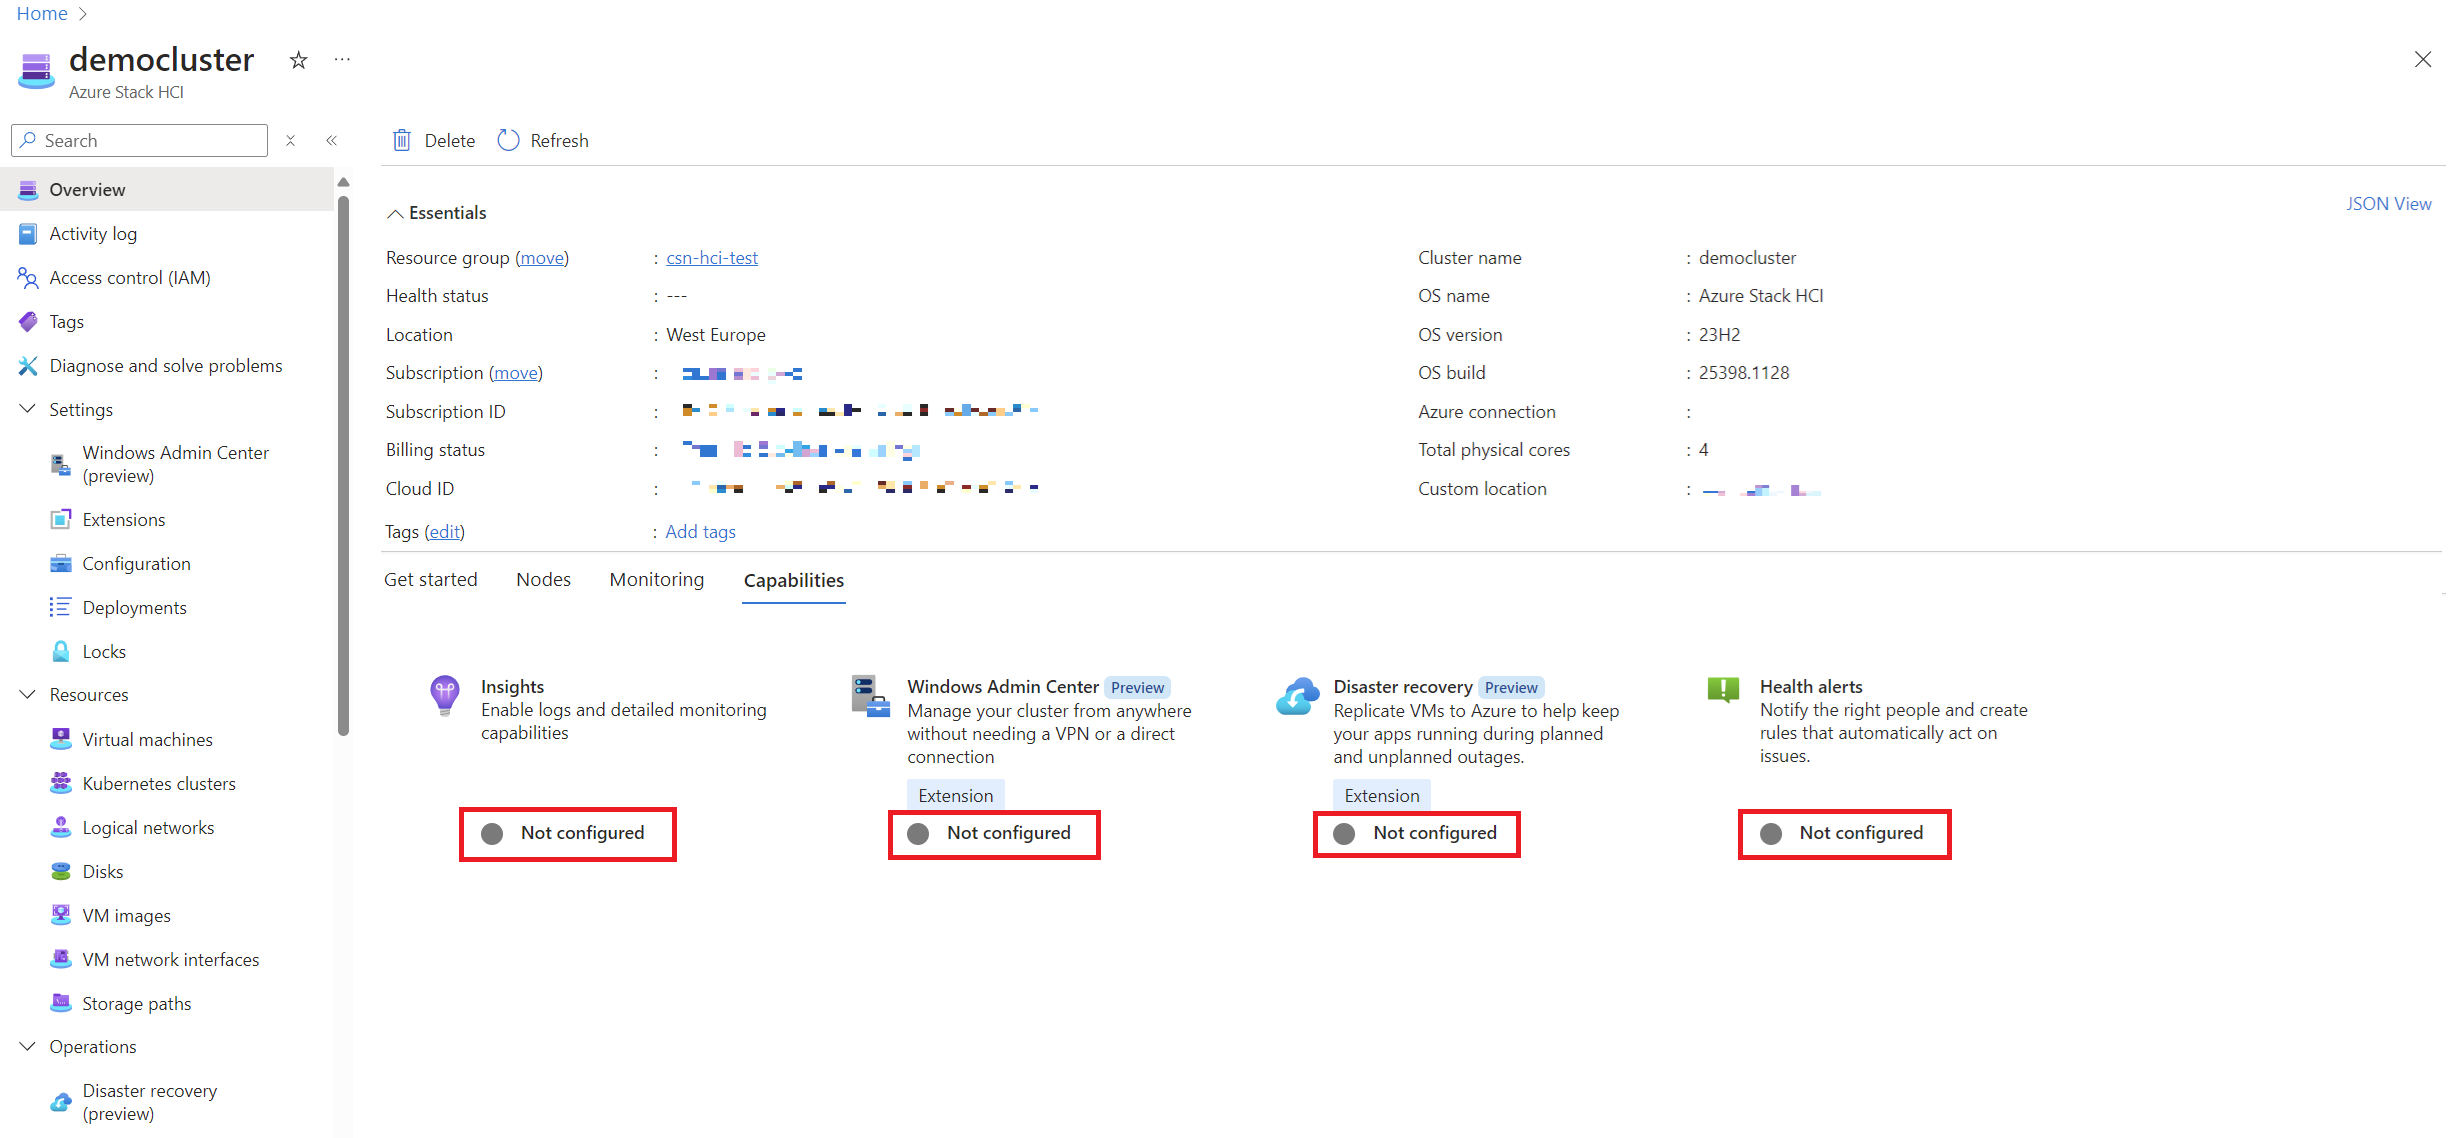
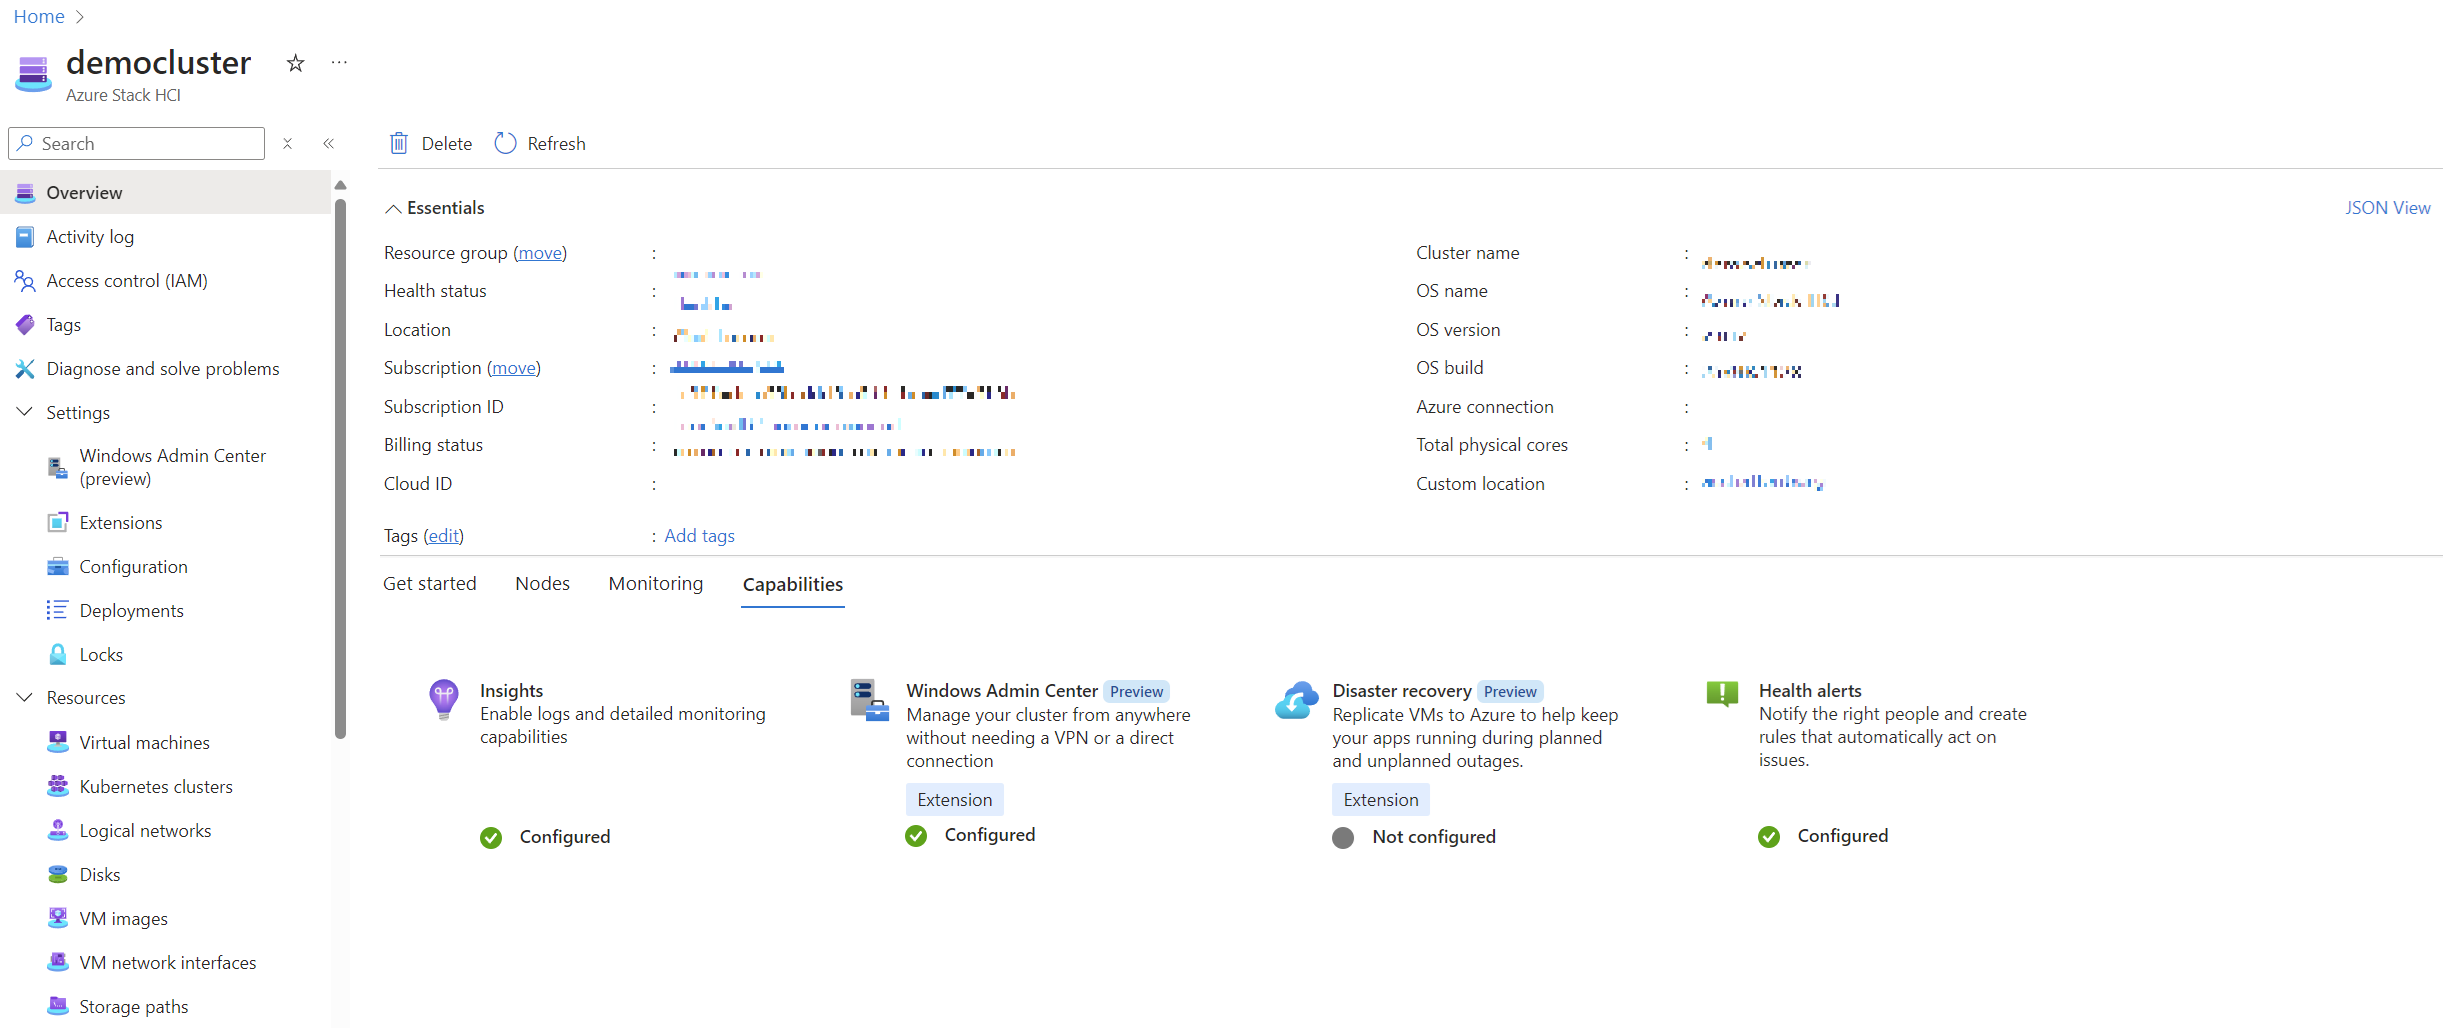
Finally, after setting up everything correctly, your environment should look like this, with all services running and green:
As I create the scripts (VM Images VHDX convertion) and workbooks (for VMs Monitoring) for the AzSHCI repository (which you can follow here), I’ll be updating this article with the new content. Keep an eye out for upcoming articles, where I’ll cover exciting topics such as:
- Deploying and managing VMs on Azure Local directly from Azure
- Setting up and managing Azure Virtual Desktop (AVD) on Azure Local
- Deploying and managing AKS (Azure Kubernetes Service) on Azure Local
Stay tuned for these updates, and don’t hesitate to check the repository for the latest tools and resources!
Thanks for following along, and I look forward to hearing how your Azure Local journey is progressing!

Comments