Introduction
Welcome back to the Azure Local series. Today I want to cover a topic that comes up often with customers: observability for Azure Local. Many organizations already use on premises monitoring like Checkmk or PRTG. Integrating clusters into those tools is possible, but it usually adds moving parts such as privileged WMI from a PAW to the cluster and that can become brittle.
Microsoft ships a basic workbook under Monitoring > Insights on the Azure Local resource. It does a good job for cluster and node level views like CPU, RAM, Storage and Network. What it does not show is a deeper look at the guest VMs.
So I built Azure Local Deep Insights, a workbook that reuses the Insights pipeline and adds extra signals. The goal is to give you a single place to understand cluster health and guest VM behavior without touching the cluster from the inside. Everything runs from the Azure portal.
What the workbook looks like
The following snapshot is from Monday 27.10.2025, taken during an upgrade from 2509 to 2510. You can see how Arc Resource Bridge moved to a fresh VM during the process.
One click deployment
You can deploy the workbook with the button below. The template expects Insights to be configured on the cluster. We will adjust its Data Collection Rule in the next section.
Prefer direct code instead of the button?
-
If you want the gallery template code as a
.workbookfile, use this link:
https://schmitt-nieto.com/assets/img/post/2025-10-31-azure-local-deep-insights/AzureLocalDeepInsights.workbook -
If you want the raw JSON for manual deployment, use this link:
https://schmitt-nieto.com/assets/img/post/2025-10-31-azure-local-deep-insights/AzureLocalDeepInsights.json
Prerequisites
- Azure Local resource enabled with Monitoring > Insights
- A Log Analytics Workspace dedicated to Azure Local data or shared by policy
- Permission to create or update a Data Collection Rule for the cluster
Enable Insights on the cluster
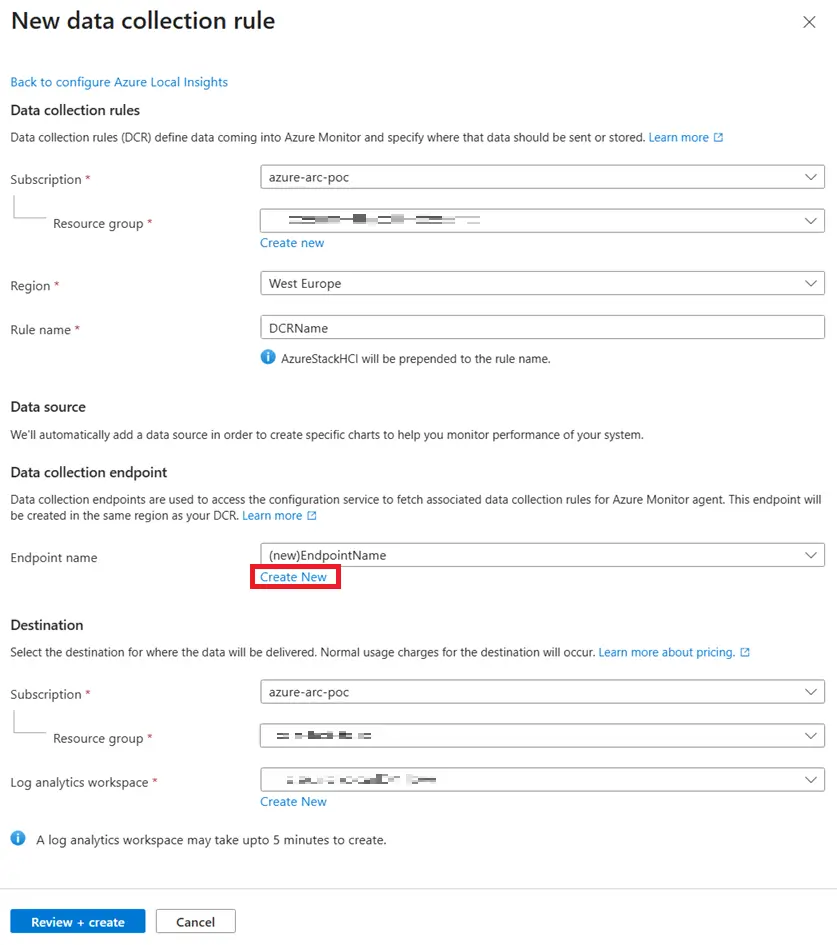
Open Monitoring > Insights, select Get started, then create:
- A Data Collection Rule
- A DCR endpoint name
- A Log Analytics Workspace
If you already use Insights you can keep your existing workspace and rule.
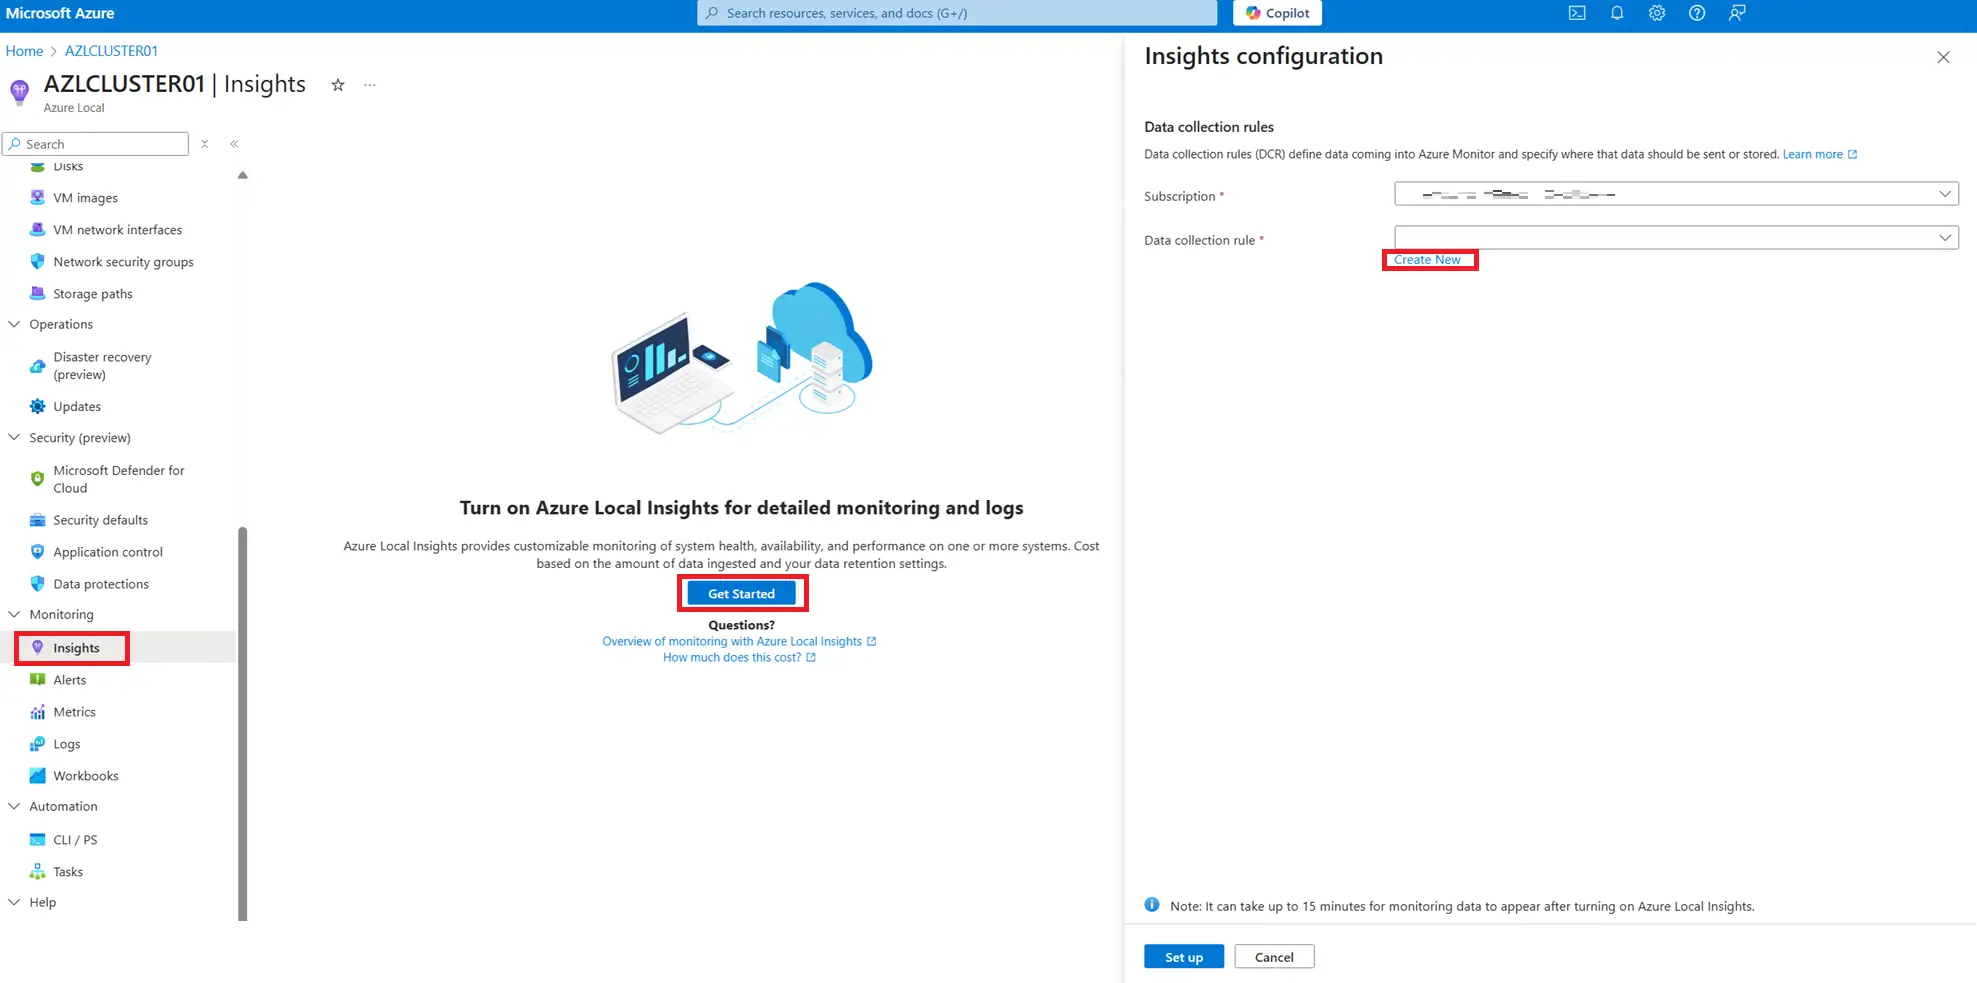
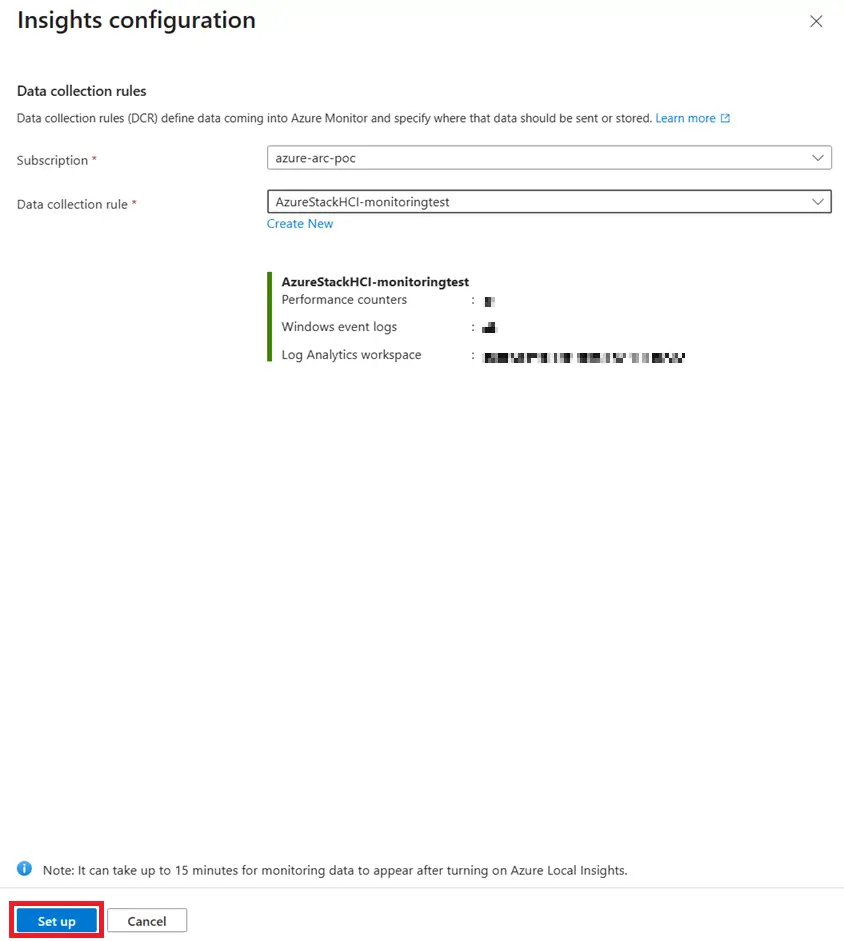
Once created, agents install on each node and a basic set of signals starts to flow. Initial ingestion can take about fifteen minutes. The default rule includes a few performance counters and event logs. The workbook extends this to include VM level views.
Extend the Data Collection Rule
To power the VM states and per VM performance, add the following data sources to the existing DCR. A 60 second sample rate works well in practice. It keeps costs low while keeping charts responsive.
Windows Event Logs for VM state
In your DCR open Data sources > Windows Event Logs > Custom and add both filters below.
Microsoft-Windows-Hyper-V-Worker-Admin![System[(EventID=18500 or EventID=18502 or EventID=18504 or EventID=18510 or EventID=18512 or EventID=18514 or EventID=18516 or EventID=18518 or EventID=18596 or EventID=18601)]]
Microsoft-Windows-Hyper-V-VMMS-Admin![System[(EventID=13002 or EventID=13003)]]
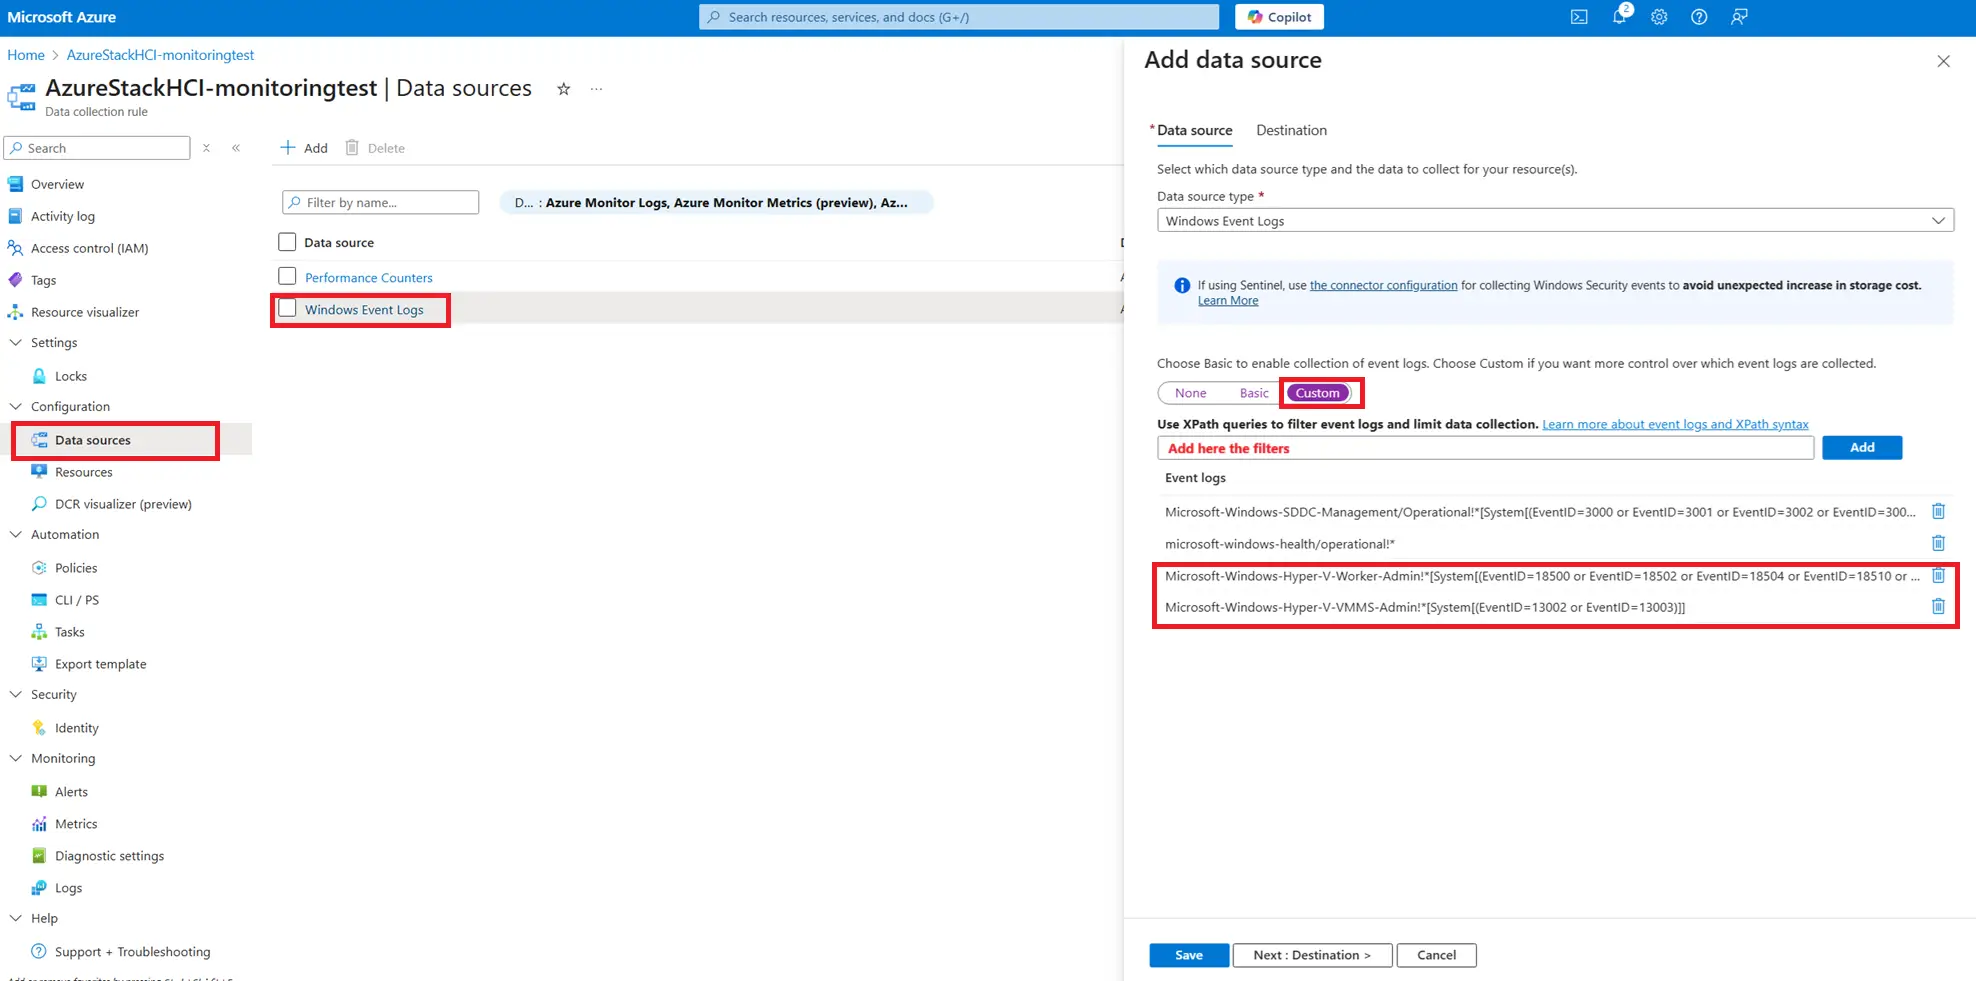
These events capture VM lifecycle from the Hyper-V view. The workbook uses them to build a timeline of Running, Off, Saved, Paused, Deleted, Created and more.
Performance counters for CPU
In your DCR open Data sources > Performance Counters > Custom and add the counters below to chart per VM CPU and hypervisor time.
\Hyper-V Hypervisor Virtual Processor()% Guest Run Time
\Hyper-V Hypervisor Virtual Processor()% Total Run Time
\Hyper-V Hypervisor Virtual Processor(*)% Hypervisor Run Time
\Hyper-V Hypervisor Logical Processor(_Total)% Total Run Time

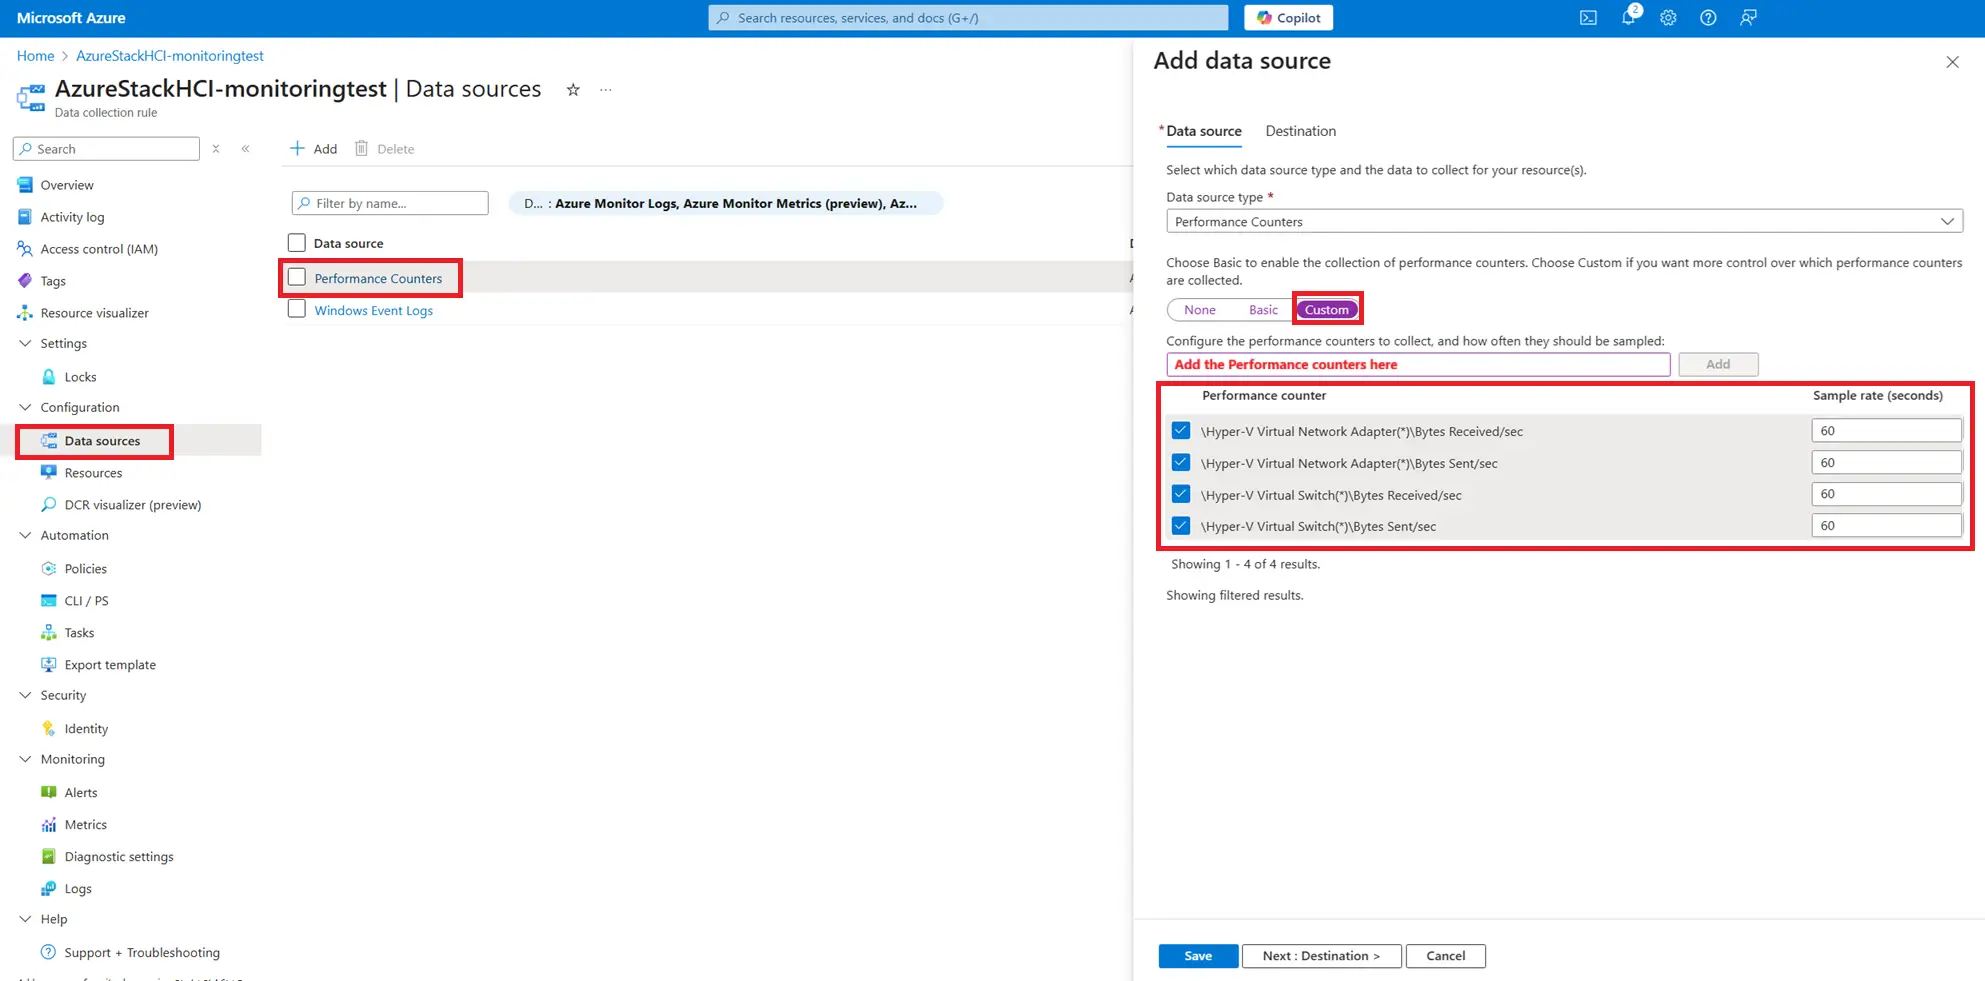
Performance counters for Network
\Hyper-V Virtual Network Adapter(*)\Bytes Received/sec
\Hyper-V Virtual Network Adapter(*)\Bytes Sent/sec
\Hyper-V Virtual Switch(*)\Bytes Received/sec
\Hyper-V Virtual Switch(*)\Bytes Sent/sec
Performance counters for Memory
\Hyper-V Dynamic Memory VM(*)\Guest Available Memory
\Hyper-V Dynamic Memory VM(*)\Guest Visible Physical Memory

I plan to add more counters over time. When that happens I will update the workbook introduction and this post.
Cross check with VMFleet
If you are new to VMFleet, it is a handy PowerShell module to view cluster state from a single dashboard.
Run the following from a machine that can reach the cluster and with a user that has administrative rights.
Install-Module -Name "VMFleet"
Import-Module VMFleet
Watch-FleetCluster -Cluster <ClusterName> -Sets *
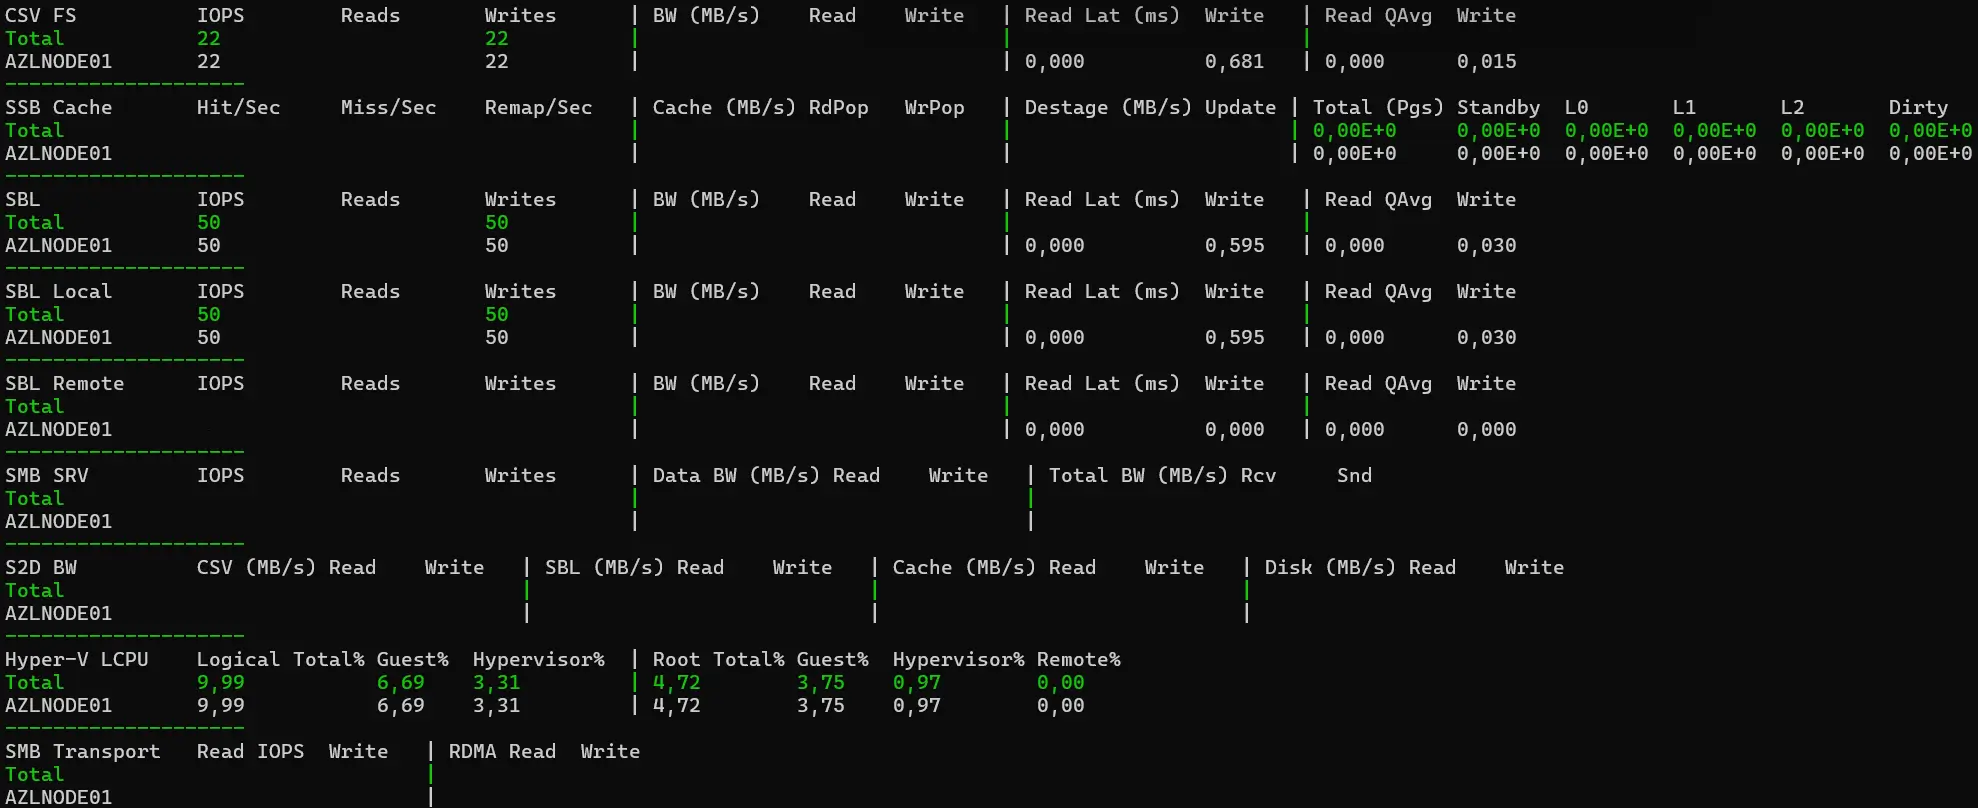
The VMFleet view is a great way to validate what you see in the workbook and get a live insights from what´s happening in the cluster.
Workbook layout
The workbook ships with the following sections:
- Overview
Quick health and Workbook information. - VM States
Timeline and counts based on Hyper-V events. Filter by host and time. - CPU
Per VM and per host charts using guest and hypervisor run time. - Storage
Capacity and trends from Insights data. - Network
Per VM and per switch throughput. - RAM
Guest Available and Guest Visible memory for density planning.
Version indicator
The workbook includes a simple image based version hint. If you see Current Version in green, you are on the latest release. If you see Need Update in blue, there is a newer build with fixes or features.


Roadmap
Planned additions include AKS and AVD views that reuse the same pipeline. Priority depends on adoption, reported issues, and spare time for development.
Changelog
| Version | Features |
|---|---|
| 1.0.0 | Initial release with sections Overview, VM States, CPU, Storage, Network, and RAM |
Comments